
Last week Michaels Energy delivered a webinar, Achieving Grid Resiliency with Thermal Energy Storage. There are about 70 gigawatts of refrigeration load in the United States frozen storage and chilled-water HVAC systems alone. That 70 GW does not include distributors like Sysco or U.S. Foods, grocery distribution centers like Walmart or Kroger, food manufacturers like Tyson or Nestle, grocery stores, convenience stores, or restaurants. Add it all up, and well over 10% of the total peak load in the U.S. is sitting there in bags, boxes, and buckets of food, waiting to be used as a flexible load-shifting and management resource. It’s distributed behind the meter in chunks of 200 to 5000 kW as load management at one-tenth of the cost of ridiculous lithium-ion batteries. As a distributed resource, it doesn’t require hundreds of millions in transmission upgrades. Did I mention the FDNY would love it because it cannot burn down buildings or kill people?
But this blog post is not about thermal batteries that displace refrigeration load at peak times to be charged off-peak. It creates a sense of urgency and demonstrates the folly of fifty-year-old benefit-cost models.
As I described in the preface of the webinar, I developed a deep-rooted passion for sustainability as I grew up in the 70s and 80s. Then, it seemed we were running out of energy, and the world was about to implode. Sound familiar? Natural gas bans in buildings are not new. There were bans on natural gas in new buildings in the late 1970s for fear of running out. Forty-five years later, we have more natural gas reserves than ever.
 Last week I received an email from S&P Global that described a topic of a webinar they are hosting this week, “In the wake of an easing global energy crisis, US natural gas and coal prices have fallen to pre-pandemic levels. Combined with greater premiums on reliability, a more competitive gas and coal generation fleet could mean higher valuations, fewer retirements, and increased market share. Is it enough to turn the tide of advancing renewable generation?”
Uh oh. Natural gas prices are at rock bottom, so electricity prices are as well, correct? Uh – no.
Full Cost of Electricity = FCOE
We have rock-bottom fuel prices and ever-increasing flows of renewable electricity that require zero marginal cost. Why are electricity prices rising? Well, for one, the levelized cost of electricity alone is a bogus metric for prioritizing sources of electricity. For now, I’ll introduce a term that is probably new to most readers: the full cost of electricity (FCOE) as in the total cost of everything required to deliver reliable electricity 24/7/365. The FCOE includes solar generation resources with capacity factors of 20-30%, wind resources with capacity factors of around 40%, transmission, dispatchable thermal generation, operations, maintenance, fuel for spinning reserves, and insanely expensive batteries. These add up to high FCOEs.
The Cost of Redundancy
The following charts are generated from EIA data showing generating capacity with (left) and without renewable resources. Dispatchable generating capacity has changed very little since 2005, while peak load has steadily increased[1].
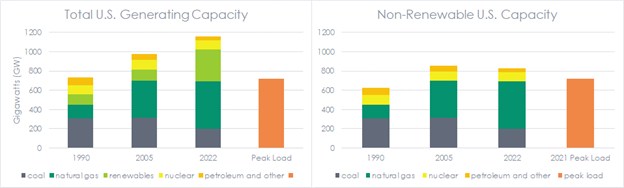 For example, the target reserve margin for the PJM interconnection is 15-16%. As of August 2021, the EIA reported a record nationwide load of 720 GW. The reserve margin nationwide from dispatchable resources (thermal power plants) for that load would be about 15.1%. On July 27, 2023, the peak hit 742 GW, dropping that margin to 11.8%. Does anyone want to bet that record gets smashed this week? As reserve generating margins shrink, prices and outage risk surge.
We have about 450 GW of extra nameplate capacity in the form of renewable generation that only displaces fuel costs. The other generating assets, O&M, and required labor to be ready are still a cost to ratepayers. It’s simple – the nameplate capacity connected to the grid is significantly greater than peak demand while reserve-generating margins are shrinking. That squeeze is causing prices and outage risk to rise.
Vastly Undervalued Behind the Meter Resources
I’ve written a thousand times that no one seriously considers efficiency and load management comparable to supply-side resources. Maybe the best reference is this Potential Studies Post featuring the brilliance of the legendary Tom Eckman. Total resource cost (TRC) tests weigh the benefits of avoided capacity (generators), transmission and distribution, and fuel versus participant and program costs. The demons are in the TRC assumptions.
Let’s look at just one thing: avoided generator cost. Avoided generator cost is known as the cost of new entry, or CONE. The choice of CONE technology is debatable. It has long been a gas turbine peaker plant at something like $238 per kW-year or $652 per MW-day or roughly $2000 per kW, considering a typical 12% weighted cost of capital.
Peaker plants are rarely used, and when they are used, they charge the firstborn and the family jewels for electricity. The image below shows the wholesale cost of electricity in Texas last Thursday afternoon, August 17, 2023.
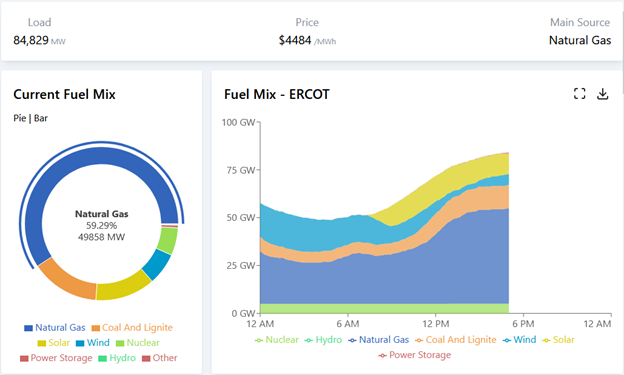 Electric vehicle manufacturers use a questionable “empg,” or miles per gallon gasoline equivalent. It’s typically around 100 mpg because gassers are about 20-30% efficient in turning gasoline into locomotion (25 mpg divided by 25% = roughly 100 empg). If I used the same logic, that $4,484 per MWh is equal to $170 per gallon of gasoline. It’s expensive. You dig?
Why are we using CONE at rock bottom $238 per kW-yr when a single kWh costs $4.50? It doesn’t take many hours at $4.50 to get to $238. It isn’t necessarily appropriate to compare the two, but the point is the value of CONE versus permanent load shift with a thermal batter is entirely out of whack.
Furthermore, the value of a capacity resource (demand response) is worth more now than it is ten minutes from now, than it is an hour from now, than it is later this afternoon than it is tomorrow. Why are all these values based on the price of a connected resource that won’t be available for years? What’s the interconnection backlog again? Almost 1,400 GW, twice the peak load of the United States. Connecting anything to the grid takes forever, especially if it burns fossil fuel.
We must move fast and quit messing around in itty baby steps every year. Prices are soaring, and outages and broader blackouts play the grim reaper at the doorstep. Some utilities are leading the charge, but it’s not enough. I will get to these items in future posts.
[1] Based on flat electricity kWh sales and rising peak-to-average demand ratios.
