
Lazard recently released its 16th levelized cost of energy or LCOE report. The LCOE represents the total cost of generating (or storing) electricity over the asset’s life divided by the total MWh or kWh delivered. The total cost includes construction, land, operations, maintenance, fuel, interest, etc.
Questionable Comparisons
The LCOE can be misleading, it’s like comparing the levelized cost of transportation (LCOT) of a bicycle, automobile, and passenger jet. The LCOE only applies when comparing automobiles against automobiles, bikes against bikes, etc., for obvious reasons.
Similarly, LCOE for electricity storage is mostly reasonable. However, comparing LCOE of renewable power generation versus baseload thermal power generation – coal, natural gas combined cycle, natural gas peaker, and nuclear is bikes to airplanes. Even LCOE of renewables plus storage compared to always-available nuclear power is bikes to automobiles.
The American Energy Society provides a lot of interesting content, and their recent newsletter crowed that “For the first time, Lazard’s new 2023 LCOE report factors storage or backup power into the total cost of renewables (as well as available IRA funds). Note: Lazard finds the cost of ‘firming renewable intermittency’ (which includes the cost of storage) is still competitive with traditional fossil-fuel generators.”
Beelzebub is in the details, some of which are in Lazard’s chart below. That may be the most information-dense chart I’ve ever seen. I break some of it down into English below the chart.
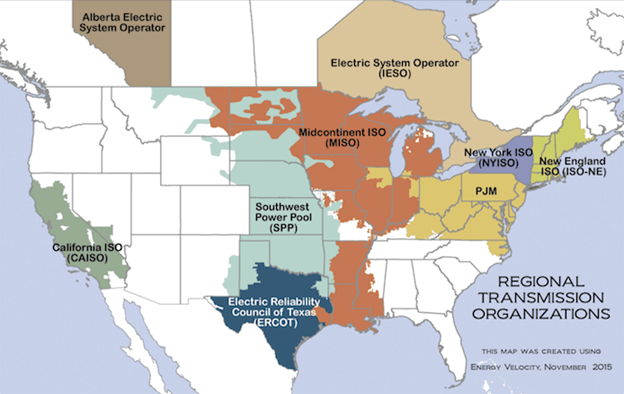
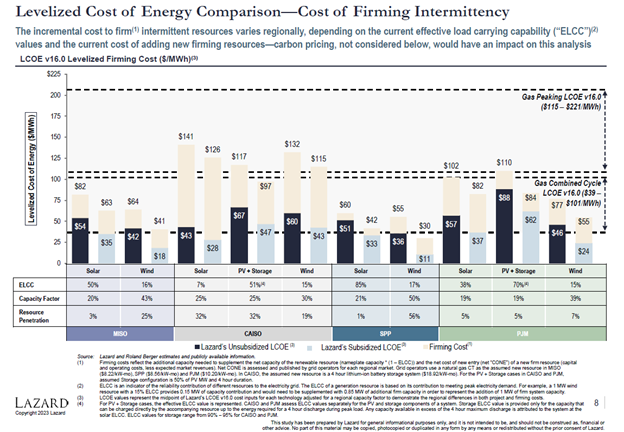 The four sets of colored columns, MISO, CAISO, etc., represent four wholesale markets on the grid. See below for reference.
- ELCC is the effective load-carrying capability. PJM explains, “A resource that contributes a significant level of capacity during high-risk hours will have a higher capacity value (ELCC) than a resource that delivers the same capacity only during low-risk hours.”
- Capacity factor is the generated electricity divided by nameplate efficiency if the resource runs at full power 24/7.
- Resource penetration is the total electric energy the resource delivers divided by the total consumed. E.g., the market share of the resource.
 Analysis
Notice that where solar penetration is low, in MISO and SPP, its contribution to avoid outages is quite high, at 50% and 85%, respectively. Compare that to where solar penetration is high, 32% in California, where the ELCC for solar is a measly 3%. Why is that Mx. Lawmaker? It’s because when the technology is infantile, it mostly coincides with taking out peak load. That benefit disappears when it matures and grows into a full-blown 500-pound tiger and becomes a reliability liability. The problem is on display in California/CAISO, known as the canyon curve, soon known as the mantle curve – requiring an incredible volume of electricity to come online very fast as the sun sets and solar power disappears.
Lazard takes a stab at quantifying the additional cost to support renewable generation to have similar reliability as a dispatchable thermal resource (natural gas, nuclear, etc.). They call it the “firming cost,” represented by the paperwhite-colored[1] bar. For MISO and SPP, the firming cost represents the cost of a gas turbine (peaker plant), and for CAISO, it represents a four-hour lithium-ion battery. The battery is significantly more expensive than a gas turbine and is good for only four hours. Good luck with that. Note that the ELCC PV plus storage is only 51% and 70% for CAISO and PJM, respectively. That isn’t reliability.
Questions
 Questions
The chart shows the levelized cost for power generated by a gas turbine to be $115-$221 per MWh while adding the same gas turbine to “firm” renewables is a tiny fraction of that (MISO and SPP). Why? How? Ask Beelzebub. I don’t know, but I can only assume the firming cost moves the LCOE comparison of the options to something like the LCOT of an electric moped[2] to the LCOT of an ICE automobile. I wouldn’t want to live on a grid powered by Lazard’s firming resource.
Price and Reliability Diverge in Wrong Directions
Lastly, I will comment on electricity prices in general. At the recent Microgrid Conference I attended in California, attendees lamented that, thus far, the energy transition has resulted in rising electricity prices and declining reliability. My question is simple: Why are prices rising if we are deploying lower LCOE resources at scale? The answer is clear. LCOE is the wrong metric. The full cost of electricity, or FCOE, is the right metric. I will cover that in another post.
This happens when lawmakers declare what our grid shall be and do while being misled by faulty metrics. Now misleading, short-duration storage costs are being added to delude lawmakers into thinking four hours of storage will give us three nines of reliability[3]. I do not believe it to be sinister, but rather hoping and wanting a different reality.
Lastly, subsidies are not free. Subsidies represent a notable externality in the form of inflation and rising interest rates to finance the soaring national debt. Everyone reading this knows how inflation and interest rates have hit hard in the past couple of years. Subsidies are a sliver of that significant problem.
The Cost of An Outage
If you remember anything from this post or all ~700 Rant posts, remember this: According to the DOE, our electric system is 99.97% reliable, and that 0.03% (2.628 hours per year) costs Americans at least $150 billion yearly, they say. What is our total electric bill? About $450 billion per year. The cost of an outage is at least 1,100 times the average cost of electricity. That DOE-cited report is over ten years old, and since then, SAIDI has exploded from 2.6 hours to about seven hours on average per year from 2017 to 2021 [4].
It isn’t hard to see that the current cost of outages is close to what we pay for electricity annually. Do you see why NERC has their undies in a bind? Are my undies in a bind? No. We are adapting our business model to mitigate the damages. In the meantime, understand reality or wish away.
Want to join our movement? Click here for fourteen-plus opportunities.
[1] Sherwin Williams 7105
[2] Charge and store outside only.
[3] Nationwide average system average interruption disruption index (SAIDI) in minutes per customer.
[4] Outage data includes major event days, which are defined by outage duration only. More avoidable outages due to cold and hot weather can still be major outages.
