
Pouring Into Texas
Money talks, and if states were holding speech contests, Texas would be the frontrunner. While states like California boycott conferences in Florida and Texas over DEI and reproductive policies, those things, unfortunately, don’t matter to some of the most progressive private-sector companies. Last week, Apple announced plans for a new 250,000-square-foot facility to manufacture servers to serve the artificial intelligence market.
Per The Wall Street Journal, Austin has the largest concentration of employees outside of Cupertino. I would guess within a decade that Apple will move its HQ to Austin. The Journal also reports Meta moved its trust and safety teams from California to Texas, following Tesla and Hewlett Packard’s headquarters moves from California to Texas. Why? Because the cost of business is lower in Texas.
A California friend of mine recently argued that California taxes aren’t that high when everything is accounted for. Mark Zuckerberg and Tim Cook clearly have a different point of view.
Electricity Load Impacts for ERCOT
Texas’ economic growth, especially with data centers, artificial intelligence, and bitcoin mining, is relentlessly pressuring the Electric Reliability Council of Texas (ERCOT) grid.
Readers may have watched or read the hoopla around data center commitments shortly after the recent inauguration. A conglomerate of AI developers led by Stargate pledged up to $500 billion in data center construction in the next four years. Their first, and certainly not the last, will be built in Texas. For reference, $500 billion in data centers is roughly 90 gigawatts (GW) of load[1]. The current peak load in the United States is around 750 GW.
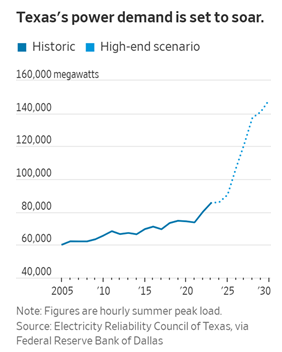
To confirm my 90 GW thesis is realistic, The Wall Street Journal[2] illustrates Texas’ projected load growth of around 50 GW in the next four years (Figure 1) to a total of 140 GW. The analysis to create Figure 1 includes new data centers and manufacturing (Apple).
Figure 1 Texas Peak Load Growth
 Market Interference
Although Utility Dive reported that added solar, batteries, and some natural gas generators helped ERCOT navigate a late August heatwave last summer, Texas legislators are throwing dirt in the lubricated drivetrain of solar and wind generation. There they go again! See what 1,500 pages of Texas deregulation look like. The recent bill requires wind and solar developers to submit a pile of red tape, including:
- Filings with the Federal Energy Regulatory Commission (What? ERCOT’s charter is to give FERC the middle digit)
- An environmental impact review with the Parks and Wildlife Department
- URL for each proposed facility
- Sending notices to judges in counties within 25 miles of the facility’s boundaries
- Public meetings for locals to excoriate developers
- Clearance of neighboring properties of 100 feet for solar and 3,000 feet for wind
- A renewable energy generation facility cleanup fund
Another bill addresses the “market distortion response” caused by federal tax credits under 26 U.S.C. Section 45. The bill states, “the ERCOT independent system operator shall adopt rules, operating procedures, and protocols to eliminate or compensate for any distortion in electricity pricing in the ERCOT power region caused by a federal tax credit provided under 26 U.S.C. Section 45.”
I’m on board with that because subsidies introduce undesirable externalities like intermittence that must be compensated for with redundant dispatchable resources. I wrote about this six years ago in Texas Heat – An Energy Market. All you need, Mx. Commissioner, is this blog to see what’s coming years in advance.
ERCOT Interconnection Queue
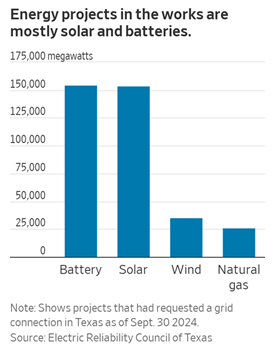
As for supply, Figure 2 shows the electricity-generating resources registered to be connected to the grid in ERCOT territories. A few notable comments about this queue:
- Like the nation’s interconnection queue, ERCOT’s is unrealistic. As of last August, total solar capacity was “only” 20,000 MW (which is a LOT) compared to 150,000 MW in the queue.
- The nation has 183 GW of natural gas generating capacity in the queue, versus 25 GW reported by ERCOT in Figure 2 or 38 GW reported by Utility Dive last summer.
- It takes 4X as many battery and solar MW for each MW of natural gas capacity because the capacity factor for solar is only 25%[3]. Batteries have an even lower capacity factor of 16%, considering the average discharge time for a battery is four hours.
- Wind resources have a more significant capacity factor than solar, but due to their less predictable generating profile, they are only about as reliable as solar for covering peaks.
- Power-generating companies like Engie are canceling gas turbine orders because turbine-generator manufacturers can’t keep up with orders[4].
Figure 2 ERCOT Interconnection Queue
 ERCOT Is Not Alone
 ERCOT Is Not Alone
Texas isn’t the only state, and ERCOT isn’t the only Regional Transmission Organization facing projected capacity reserve-margin squeezes. Reserve margins are shrinking fast in the PJM Interconnection. Last year, 6.6 GW left the supply stack and only 0.86 GW were added. PJM and Dominion Energy (Virginia) capacity prices jumped 6-10X in the most recent capacity auction.
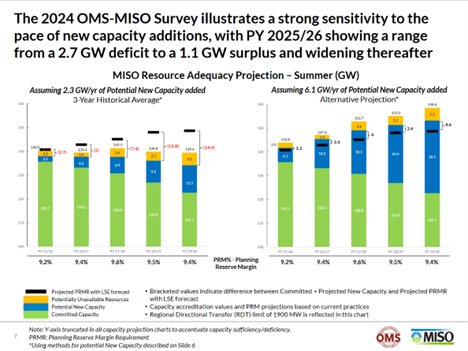
Per Figure 3, the Midcontinent Independent System Operator arguably faces more alarming shortages. Recent history (2020-2022) shows that only 4% of grid interconnection agreements are realized yearly (2.7 GW, on average), while the make-a-wish projection is 6.1 GW additions annually through 2030. The latter projects plenty of capacity, while the former, which is more closely aligned with actual additions, is woefully short.
Figure 3 Midcontinent Independent System Operator Planning Reserve Margin Requirement Guesses
 So, what if we can’t build our way out of this AI and manufacturing surge? Load will be managed, one way or another. I don’t think rolling outages are considered a desirable form of demand response. There are better ways. Conventional load management and demand response, and especially thermal energy storage with added benefits of temperature stability, resilience, long-duration storage, and energy efficiency.
[1] Based on actual new construction specifications, circa September 2024.
[2] WSJ Climate & Energy Newsletter, February 27, 2025.
[4] WSJ Climate & Energy Newsletter, February 27, 2025.
