
Texans may need Tabasco, not just for their favorite dish or condiment, but as a deterrent to chewing their fingernails as they ride the cliff of blackouts this summer. Numerous articles, including this most recent one I saw from the Fort Worth Star-Telegram, caution of rolling blackouts as capacity margins are less than 7.5%, which is about half the margin the Electric Reliability Council of Texas (ERCOT) would like to maintain.
Supply and Demand
I drew a cartoon showing supply and demand curves for differing scenarios below. Sales will increase slightly at lower prices. Electricity sales are very inelastic in most places in the U.S. Elasticity can be added through time-of-use, especially super peak pricing, or day ahead pricing. Supply curve prices vary much more as less-efficient, more rarely used sources come online. The intersection of supply and demand curves represents the sales price. I have four prices (intersections) in my cartoon for two demand curves, each crossing two supply curves (2×2=4).
Supply
Electricity supply curves move around a lot depending on the time of year and whether the wind blows in Texas, a deregulated state. For example, supply curves move to the left in spring and fall, when thermal plants, including nuclear, coal, and natural gas, are down for maintenance and refueling (nuclear). Perhaps more drastically, supply curves move around depending on the wind. In calmer weather, I would expect the supply curve to move to the left and up. As shown, when the wind is blowing briskly, the price can even go negative, because windfarm owners would rather generate energy for the two-cent tax credit and dump it on the market at a negative price, than to let their assets sit there and generate no revenue at all.
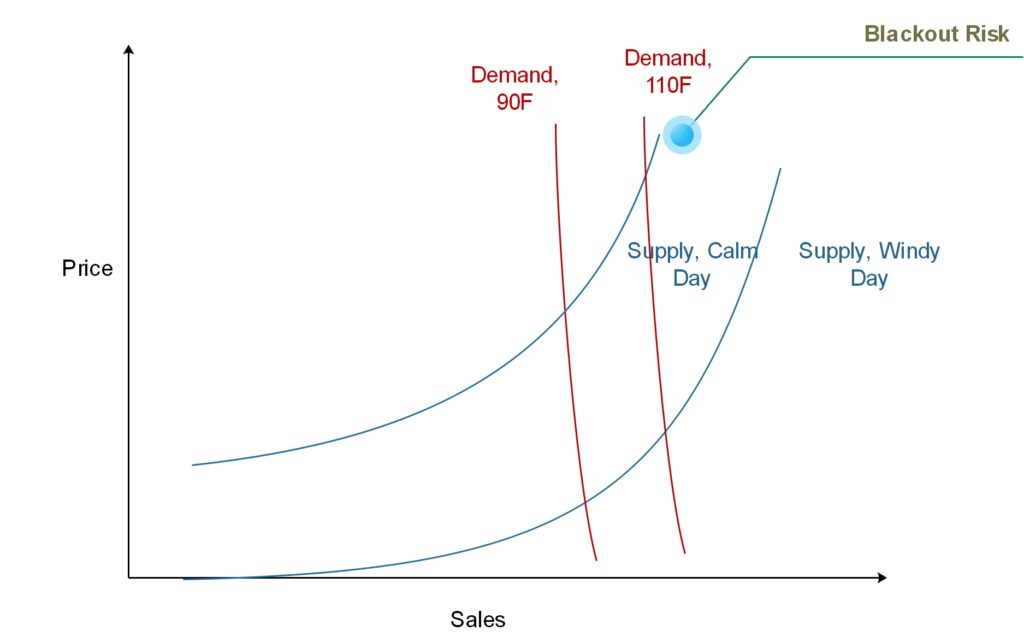
Now consider a calmer day. The wind generators get a higher price, but maybe less revenue because they are selling lesser amounts of electricity. Note the supply curve for the windy scenario is flatter at low volume because the incremental cost of no fuel for wind is zero. This is not the case for generators requiring fuel, and so the curve at low demand is slightly steeper for the low-wind scenario. At high demand, all the incremental electricity production requires fuel and operating cost, and therefore, the curves should be parallel at that point.
Demand
On the demand side of the balance, we have almost complete inelasticity – nearly a vertical line. Consumers don’t change behavior with consumption. I present a curve for a summer day with a high temperature of 90F in Dallas. When it heats up to 110F, the demand curve moves right. We can see when the wind is blowing it isn’t a problem, but when it isn’t, and the supply curve shifts left, uh oh: blackout risk.
Note there are a couple of things not shown on the chart. First, I’m not showing demand response, which would bend the demand curve to the left near the top, thus mitigating the blackout risk. Second, not shown is the price cap on the market. Last I looked, the price cap was $9 per kWh.
Stressed
The primary reason Texas is stressed to the point of blackout is the closure of thermal power generators – ones that are dispatchable and reliable. Forbes reported that 25% of Texas’ coal fleet was retired in 2017. Earlier this year, Utility Dive reported that the 470 MW Gibbons Creek coal plant will retire. It is getting so dire that with a 72,000 MW load, ERCOT is sweating the loss of 500 MW. Peak load is growing while reliable thermal generation is dropping offline. The reason for thermal generator closures is easy to see. Look at the difference in prices between the windy day and the calm day in the chart above. In a “free” confined electricity market, all generators get the same price at any given time. Wind generators are the ants at this picnic. They are the raccoons in the sweet corn patch[1]. Wind generation drives down prices when reliable sources would otherwise turn profits. It’s too much to handle for these plant owners.

Energy Market Flaw
For a refresher on energy (electricity) markets, refer to Capacity Market v Energy Market – What’s the Diff?. Energy markets are quasi-free markets where demand for electricity sets the price for a given supply curve.
To summarize, capacity markets pay generators to exist – to be ready for dispatch – plus energy sales. Energy markets only pay for energy sales. Experts, not just I, think this will ruin energy markets.
All system operators seek to achieve a capacity margin of 10-20%. But in a different article, Utility Dive reported, “[energy markets protect] consumers from paying for generation that may never even be called on to provide power.” To that I would reply, what is a model that will lose capacity margins, Alex? How do you expect capacity margins in such a market, especially one that is flooded with 2.4 ¢/kWh wind subsidies?
Steve Mitnick from Public Utilities Fortnightly has written dozens of times in the last year or two that electricity costs as a percent of the economy are scraping all-time lows – as though that is a good thing. It’s good while it lasts, but it will rebound soon when grid operators find their capacity margins are evaporating as a result of cost shifting from ratepayers to taxpayers.
[1] Racoons ravage the crop just days before the preferred harvest date. They will find a half acre of sweet corn among 200 acres of field corn (ethanol, corn syrup, corn oil, livestock feed).
