
Last week and many other times, I’ve written about soaring electricity loads and prices climbing even faster. The reality is prices are rising much quicker than load. For example, grid loads in Oregon have increased at a compounded rate of a modest 2%, while prices have risen by a compounded rate of nearly 9% in the same period. Why is that?
Wholesale Electricity Supply Curve
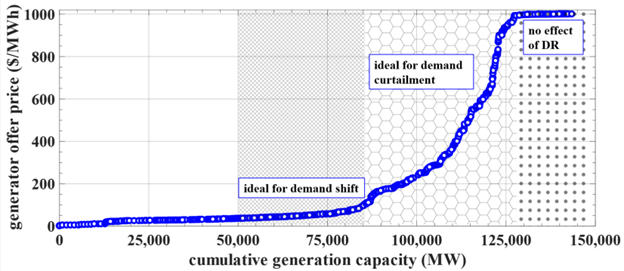
A year ago, I demonstrated using a typical generation supply stack from PJM, reposted in Figure 1. Each dot shown represents a generator. Refer to one of my concluding questions last week, “Will stakeholders increase, or better yet, lose price caps on capacity auctions to lure sufficient long-term (power plants) and short-term (load management) resources into the market to keep the lights on?” We can see the deleterious impact of price caps on this curve, “no effect of DR,” DR being demand response. There is no arbitrage benefit when loads increase into the zone of the price cap. This isn’t good. Amen.
Figure 1 PJM Supply Curve
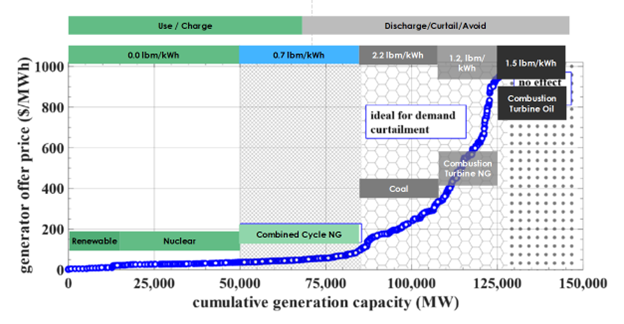
 In that post a year ago, I added annotations to show the value of load shifting and overlayed likely generating assets, as shown in Figure 2. Focusing on the steepest part of the curve where the likely gas peakers are meeting the load, I calculate an added load of only ~4 MW, 3%, results in a market price increase of ten times that, or even more, from the low $600s to near $1,000 per MWh, or $1.00 per kWh – which is expensive even by California terms.
Figure 2 Generation, Carbon Content, and Load Curtailment Value
 Circling back to Portland General Electric CEO Maria Pope’s claim that market forces are driving prices higher at a rate four times faster than load growth, she’s right, as I just demonstrated. The problem is that the reserve capacity of overbuilding has shrunk the supply curve as demand has grown a little, putting electricity markets onto the steep part of the supply curve.
Demand Response Benefits
The source of the PJM curve, Benefits of a Demand Response Exchange Participating in Existing Bulk-Power Markets, explains that demand response can be used to participate in capacity (kW or MW), energy (kWh), and regulation (frequency or voltage). The overwhelming benefits flowing to customers are from the emergency (capacity) market, at a rate of almost 200x of the energy (economic) market: $649 million versus $3.55 million. Why is this? Because there is no mechanism, financial incentive, or reward for utilities to do economic energy-market dispatch except maybe to keep senators off their backs. As shown in Figure 2, energy-market dispatch incentivizes customers to curtail consumption in the honeycomb portion of the supply curve and consume in the diamond portion (Combined Cycle NG) portion of the curve.
The benefits of economic dispatch are undervalued because the price of wholesale electricity is paid by all customers, while the meager benefits of economic dispatch flow only to customers who shift load. Emergency dispatch (capacity) benefits all customers by keeping the grid energized while charging customers a lot more to curtail load.
Wholesale-Retail Balance
While wholesale prices can swing wildly per Figure 1, retail prices are very flat, even if there are time-of-use rates, seasonal rates, demand charges, etc. Retail price fluctuations are relatively tiny compared to the 10-100x moves in the wholesale market.
Load-serving entities (LSEs) such as vertically integrated, investor-owned, monopoly utilities, retail providers in deregulated states, public utilities (including municipalities and cooperatives), and community choice aggregators buy at wholesale prices and sell at these relatively flat retail rates.
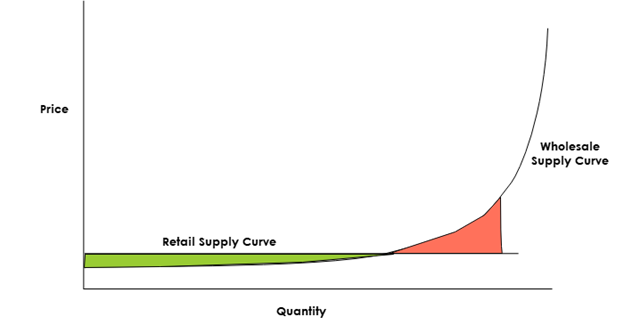
Let’s flash back to December 19, 2023, Load Flexibility vs. Indeterminate Supply and Demand. Figure 3 includes a wholesale supply curve that resembles the one in Figure 1. It also contains a flat retail supply (price) curve. I pay one price for eight months a year, regardless of what Xcel Energy pays on the wholesale market. For the other four months in the summer, I pay a slightly (tiny) higher rate. The green area represents times when LSEs buy for less than they sell, and the red area is where the wholesale purchase price is greater than the retail selling price. Don’t consider it profit or loss because that’s not how it works.
Figure 3 Wholesale and Retail Supply Curves
 Utilities add up all the wholesale purchases, tree trimming, storm recovery, fuel purchases, billing and metering expenses, labor, etc., and add some profit, usually around 13%[1]. That total is called the revenue requirement. Keeping it simple, they then divide the revenue requirement dollars by unit energy sales to achieve the retail rate. Retail energy users like you and me see zero to near-zero price signals – even with time-of-use rates and demand charges. They are puny in fluctuation compared to the fluctuation of wholesale prices.
How to Reward Economic Dispatch
I wrote that the benefits of economic dispatch are undervalued because the price of wholesale electricity is paid via the revenue requirement just described. There is a ton of headroom to pay customers a lot more for economic dispatch, reducing the revenue requirement and electricity costs for all customers. That is the crux of the paper referenced above.
So why not pay volunteering customers the actual value of economic dispatch and incentivize utilities to do so? A mechanism to pull this off is called performance-based ratemaking. I had a conversation about PBR with Doug Scott, the current Chair of the Illinois Commerce Commission, a few years ago. Check it out.
What’s an easy way to deploy economic dispatch? Thermal energy storage. Just sayin.
[1] Public and community choice aggregators skip the profit part, which is generally why their prices are lower.
