Texas broke six daily electricity records in one week, ending July 20. Alectra, serving Southern Ontario, broke its peak electricity demand record on July 5. More than 80,000 customers in Southern California lost power due to excessive electric demand earlier this month.
If that didn’t make your eyes pop, maybe this will: Alectra’s record surged by 8.3% to 5,056 MW. The Electric Reliability Council of Texas reported its record increased by 3% over the previous record to 73,259 MW.
Restoration Power is Highest
Still more interesting, when the circuits are at risk of overload and are shut down, as they were in the California case, buildings cook, refrigerators warm, and freezers melt. Consider all cooling systems, especially residential systems, are grotesquely oversized. When you throw the switch to bring these circuits back on line, they can draw extraordinary power. A thousand homes that have 50% oversized cooling units draw 50% extra power when the juice is restored.
Does anyone account for this benefit of efficiency programs[1] when running benefit-cost tests?
Generation Efficiency is Lowest
Power plant efficiency is least efficient in hot weather. As noted recently, efficiency is most simply defined as output over input. For power generation, this is net power supplied from the plant divided by fuel consumption. As described here and here, efficiency is proportional to the difference between high (fire) and low (water or air) temperature. When it’s hot, the low temperature is high, temperature difference shrinks, and power plant efficiency drops.
You might think, well, solar panels are pounding out kilowatt-hours. Yes, as poorly as 50% of peak efficiency during hot weather. And wind? Although efficiency is not affected, wind blows the least during the hot diggity dog days of summer. Google any monthly wind generation plot, like the one below, to see for yourself.

Does anyone account for horrendous generating efficiency for benefit-cost tests?
Line Losses are Highest
Furthermore, transmission and distribution systems are least efficient when they run hot. Simply put, molecules that make up conductors vibrate more, increasing collisions of passing electrons – resistance.
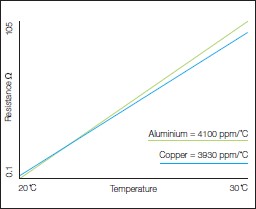
Resistance increases linearly as shown nearby. Line losses (wasted energy) are proportional to the load carried, squared, times resistance, which increases. In equation form it is:

Where: i = current; r = resistance
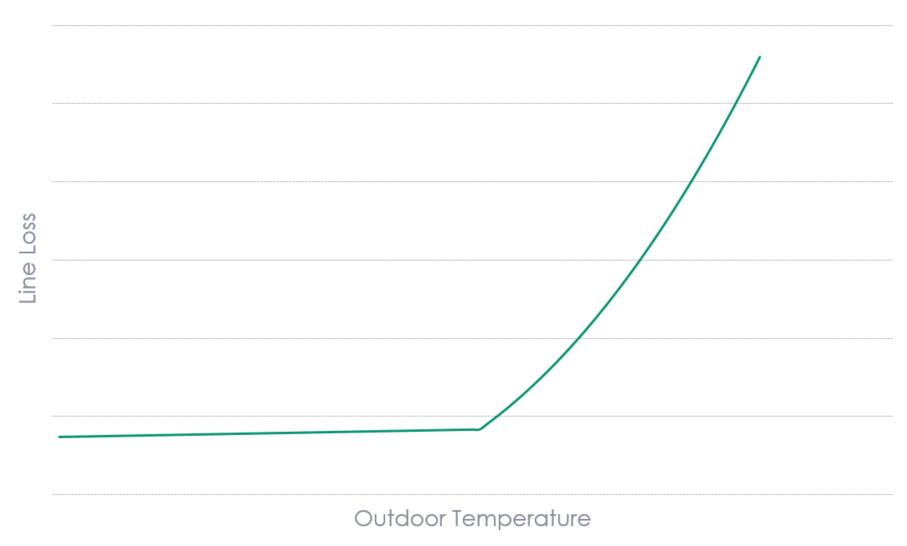
In short, geeks call it I-squared-r losses. A simulated plot of how these losses change with temperature, including cooling load for space cooling, is shown below. This is super-simplified and may be representative of the line losses feeding a commercial or residential building. But what is clear, is line losses soar with load and temperature.
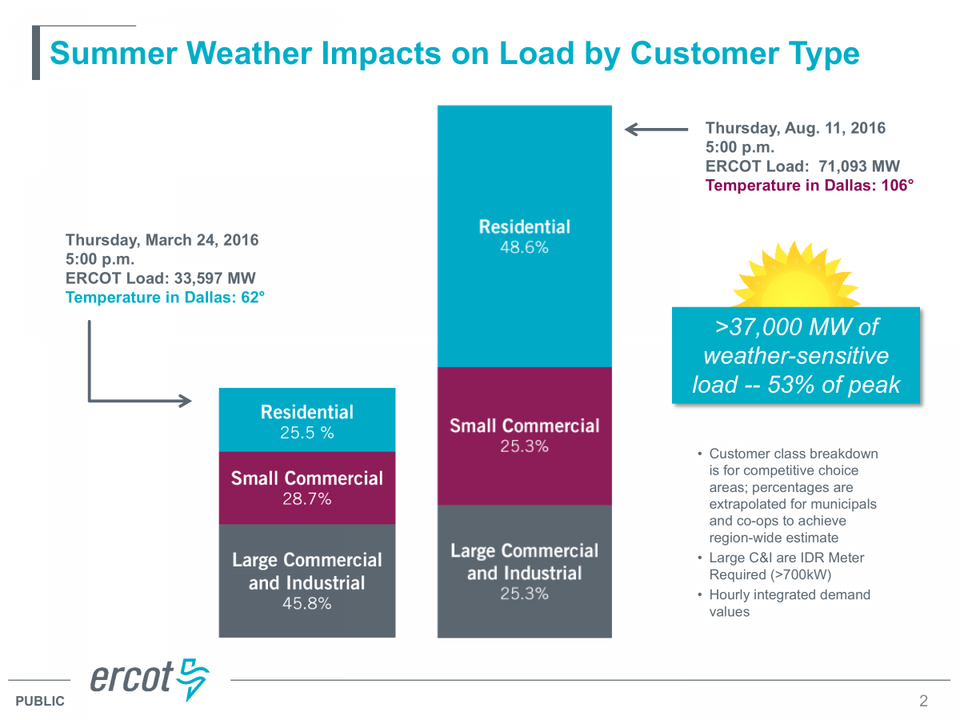
In Texas, weather-related peak energy is 53% of the peak load as shown in the graphic below. My SWAG was 60% – close enough, and I’m sticking to it.
Does anyone account for soaring line losses in benefit-cost tests?
Incremental Cost of the Last Oomph
Interestingly, mechanical and electrical systems behave much the same way due to the laws of thermodynamics and electricity. Adding the last incremental boost costs a fortune. For instance, the incremental power required for a submarine to increase from 30 to 33 knots, is not 10%, or even close. It might be 50%. It’s 33% if you assume you can cram the same shaft horsepower into the hull, but you cannot. Everything gets bigger, kind of like linear component of line losses. When everything gets bigger, the drive train needs to push a bigger hole through the water – necessitating more than the 33% theoretical increase.
Saving the Last Oomph
Texas is a deregulated state with an electrical energy market, rather than capacity market like PJM (Pennsylvania, New Jersey, Maryland) and the Independent System Operator (ISO) of New England. Capacity markets pay suppliers to have capacity available, whether it is used or not. In this way, it is like a demand rate, where customers pay for demand (kilowatts) and energy (kilowatt-hours). Capacity market suppliers get paid in the same way as customers pay for electricity.
Energy markets purport to avoid paying for capacity that is not used. For a beautiful refresher, see Capacity v Energy, What’s the Diff? Brace yourself for soaring energy prices because if you tell me you will only need my generator or storage unit a couple hours per year, I need a massively high price for that.
As a result of the energy market model and massive amounts of fickle wind built in Texas, power prices can increase to their limit. Earlier this summer, Texas prices hit $4 per kWh – like $120 per gallon of gasoline. Think that’s a lot? In January of this year, prices crossed the half-pregnant-free-market limit of $9 per kWh, or like $300 per gallon of gasoline. For a reasonable car cruising down the interstate, that’s $900 per hour of fuel cost.
Many, if not most states, use a dumb cost of kWh for avoided cost in benefit-cost testing of efficiency programs. That is, take the total cost of all kWh sold and divide by the total kWh. However, we are not avoiding the average cost. We are avoiding the marginal cost.
Consider wind-fueled kWh. These free kWh are driving down the average cost of electricity – and cost-effectiveness of efficiency. A utility strategy? You be the judge. However, wind is the new definition of base load. It is the base. It always sells first, even if at negative prices. We are not avoiding any of those costs (zeros) so get them out of the equation. We’re avoiding cost at the margin, like $900 per gallon.
Use the marginal cost of electricity for benefit-cost testing, ever hour of the year, and not the dumb cost, for efficiency and demand response benefits.
[1] Quality installation