
In theory, normalized metered energy consumption, or NMEC, would allow demand-side resources, whether dispatchable (demand response) or non-dispatchable (efficiency, demand rates, time of use, peak rates, etc.), to be precisely measured with equipment customers have already paid for – smart meters and the advanced metering infrastructure. It would work like this: What does the meter say before intervention (like a bathroom scale)? What does it say after intervention? The difference of the two is the resource.
What could go wrong? Plenty.
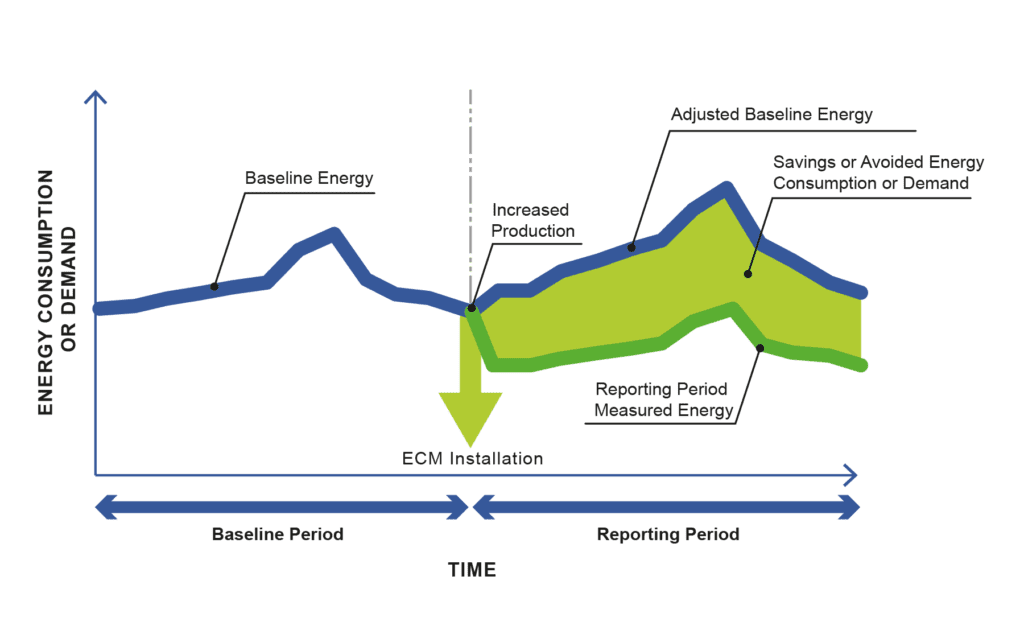
Last week I suggested we need protocols and not just user’s manuals for deploying NMEC. This week, I deliver the goods as some folks are waiting with bated breath. Seventy five to eighty percent of sound NMEC deployments would be those that are best suited for IPMVP, option C, whole building metering – the M in NMEC. Their website includes a cartoon of a regression-model assessment, shown below. The cartoon depicts a pesky non-routine event, which in this case, is easy and cost effectively rolled into the NMEC analysis. It’s cost effective to adjust because it’s big.
So let us look at some of those programs I mentioned last week, starting with the ones that are best suited for NMEC.
Home Energy Reports, Weatherization and Envelope Improvements
IPMVP Option C is the gold standard and the only reasonable way to determine savings for home energy reports, including dashboard and information-based programs, plus weatherization and envelope improvements. One could calculate something for weatherization savings, but with so much guesswork that Option C will always be better.
For any type of behavioral program, an aggregate NMEC approach is best for these programs because we need confidence-in-numbers to achieve industry-standard confidence levels (90%). The sample size has to be massive because the impacts are just a few percent. This requires a “quasi-experimental,” judgment-based test and control group selection using either of the following less-than-perfect approaches.
- Select a test group and a control group and watch how the intervention impacts the test group’s energy consumption. When samples are appropriately drawn, this, in theory, wipes out all the pesky non-observables.
- Compare the participants’ energy patterns before intervention to the patterns after intervention. Here, as far as I know, only weather can be rolled into the normalization equation.
What are the risks with #2 versus #1? When does school start? When is Christmas break? – especially for college towns. …and so on.
Strategic Energy Management and Other Feedback-Loop Programs
Strategic energy management, or SEM, and other feedback-loop programs such as energy-information-systems programs are good fits for NMEC. Not only is NMEC used to determine savings, it provides a feedback loop to motivate these customers to do more and stick with the regimen. However, applying NMEC to these types of programs introduces the pesky non-routine, non-observables.
What’s Connected?
We’ve been in thousands of buildings. Not only are no two alike, no two are metered alike. Consider our four-story 70,000 square foot office building, built in 1908 as a department store. Every floor has a gas meter and an electric meter. Most of the building is served by one chiller in the basement. We have a triple net lease and without asking, I cannot tell you how the chiller’s electricity use is apportioned to the floors it serves. We live here. We live this work, and I don’t know.
The Utility Data Labyrinth
Utilities have billing systems, customer relationship management systems, DSM program databases (tracking systems), and maybe more. There is typically little interconnection between these database resources. There are premise numbers, meter numbers, addresses that don’t exist or match, account numbers, this system for billing information, and that system for interval data (needed for NMEC). Did I mention there may be only one or two people in an entire utility who can produce batches of interval data? I’m talking about “large” utilities as defined by JD Power.
Getting it Done
The NMEC theory is there are rooms full of people like this guy sitting at their workstations munching Cheetos and swilling Tab soda as they remotely assess savings with no touchy, no talkie.
But a mess of non-observables looms, requiring an engineer and a team of runners to clean up these non-routine events, or NREs, including things like:
- Tenants clearing out entire floors of an office building, or the reverse.
- Shutting down hospital wings for remodeling, which is ongoing, CONSTANTLY.
- Changing product lines. E.g., switching from shells to linguini, or sugar puffs to cornflakes.
- Equipment replacement not related to the program.
- Whimsical behaviors.

Now consider the typical SEM participant. They have a goal. They want to save some energy, and they have support from the top. Assuming the above submetering mysteries can be solved, a commercial property manager has a snowball’s chance of getting their arms around NREs for SEM, continuous improvement, and NMEC energy analysis.
Manufacturing customers are going to be more like the ever-shifting hospital, but with more frequency and bigger swings. Are they used to documenting every production change, equipment replacement, and product line adjustment? Sometimes yes, but often times, no. We energy analysts need accurate NRE data or it can throw the NMEC impact assessment by 30% or more. As I wrote a while back, there is an upward bias toward NMEC savings. If the NMEC Jedi sees there are more savings than predicted, he takes it. If it’s less, he deploys the Troopers to explain it away.
I’ll see if I can wrap this up next week and put a bow on it. I have plenty more to share.
