As of last week, year-to-date energy prices are up 58% for NYMEX crude oil, 91% for NYMEX gasoline, and only 39% for retail gasoline. Retail prices seem to have a long way to climb as the high NYMEX prices make their way to the local gasoline pump.
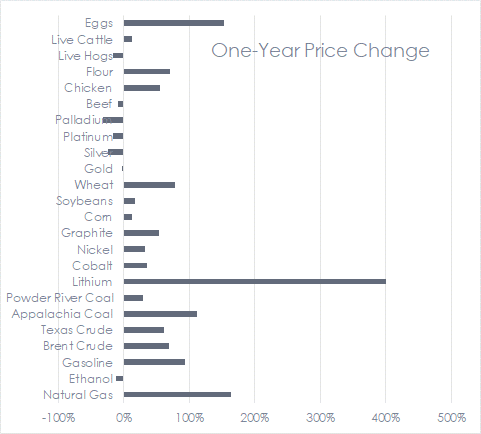
This week we look at how inflation is hitting our industry of efficiency and electrification and what might lie ahead. Let’s start with one-year price changes for a basket of commodities and roll forward with that[1].
 Diesel Fuel is Food
Diesel fuel is used to transport seed, chemicals, fertilizers, and equipment to the farm, till the soil, plant the seed, harvest the crop, transport it to factories, and finally get it to the grocery store. Scenarios vary, but the bottom line is that tractors, trucks, combines, ships, and trains use numbers 2 and 6 diesel fuel to put food on our tables.
Refining Outlook
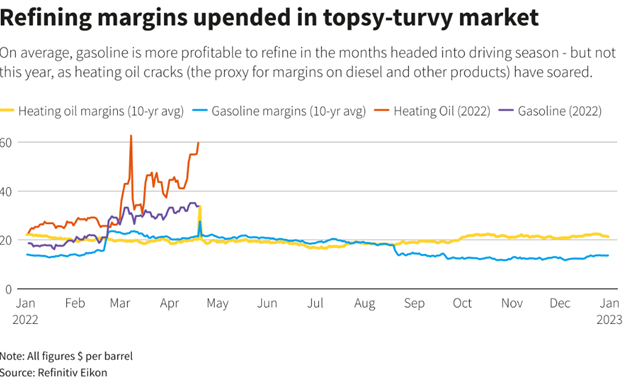
Reuters reported that diesel fuel and gasoline margins are near $60 and $34 per barrel, respectively. Wow! Why the discrepancy in margins? From my studies a few years ago, the type of fuels crude oil can produce is mainly a function of the variety of crude, and there are dozens of types. To refine crude into liquid fuels and other things, it is vaporized, and the various hydrocarbons are condensed to produce the fuels: propane, gasoline, numbers 1, 2, and 6 fuel oil, etc. You get what you get with little leeway among the product mix. The market sets prices.
Regarding high margins, the usual myopic ideas are floating to the surface, like price controls and windfall profits taxes. As one author put it, “Like price controls? Get in line.” Price controls produce shortages – wait or go without. Windfall profits taxes would signal producers and refiners to reduce supply and, therefore, increase prices.
Note, the number of refineries in the U.S. has declined by 10% since 2016, and refining capacity has decreased by 4.5% since Covid year 2020.
Electricity Prices and Electrification
You might be thinking, “Hurray! Fossil fuel prices are soaring, opening the door for electrification. States with heavy concentrations of renewable energy are great places to be!”
Not so fast.
About two-thirds of the country’s electric load is served by competitive wholesale electricity markets managed by regional transmission organizations or RTOs shown below.
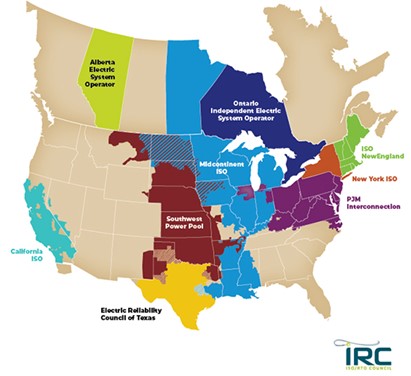
The RTOs operate reverse auctions, as you have seen in this blog. Here is a refresher on the subject. All generators putting power onto the grid get the same price at a given moment – the marginal price of the generator(s) that maintain frequency and voltage. Those plants are powered by natural gas – price up 164% from a year ago. Utility-scale renewable generators get the same inflated price as the natural gas generator. I bet we won’t see anything about windfall profits taxes on wind generators.
Punchline: the price of zero-fuel renewable electricity is the same as that which is generated by natural gas (up 164%) or more expensive fuel.
Electric Vehicles / Batteries
The price of technologies like computing power, data storage, and other electronics doesn’t always fall. Unlike almost everyone assumed, lithium-ion batteries are not in the club of continuous dropping prices because they require large amounts of exotic, rare materials. Although lithium is less than 10% of battery material[2], it wins the prize for price increases at 400% since last year. The most prominent metal in batteries, nickel, is up a mere 32%. In toto, the cost of EV batteries has increased 60% per kWh, and market adoption has yet to cross the dreaded chasm, which requires ordinary people to embrace the technology. What will costs be at that phase?
Political Wars
The President made bold moves to pinch fossil fuel supply, canceling the Keystone pipeline (and 99 other things), which would carry the black goo, rich stock for diesel, from Alberta’s tar sands to Gulf Coast refineries. Those moves sent strong signals to the markets. Even though profits are sky-high, drillers are not increasing production.
The Wall Street Journal reports, “[drilling] companies expect that as soon as the current turmoil subsides, the Biden administration will shift back to hostile rhetoric, anti-energy legislative proposals, and oppositional regulatory policies.” Instead of increasing supply, they are returning cash to shareholders. I surmise they are letting the boil fester until November 8.
How Did This Happen?
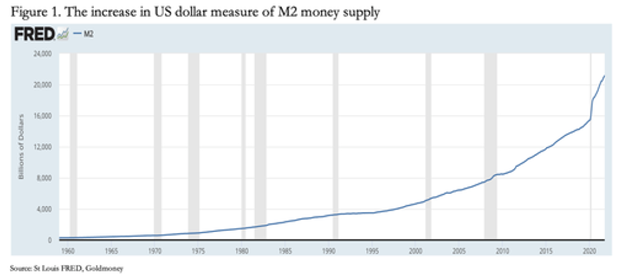
Remember the free money the government showered on individuals and companies over the last two years. We aren’t getting away with that. That money diluted what we have and inflated the price of almost everything. I cautioned against this in 2009, but that was smallball compared to the last two years. The money supply should grow in lockstep with the economy, but it has grown much faster since 2020 at an annualized rate of 23%.
Inflation is called the “cruelest tax” because it hits all consumers, especially those with low income. But it is also a wealth tax on lifetime savings that punches retirees in the face.
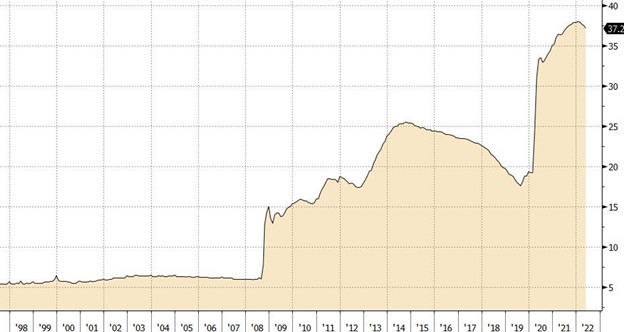
Another look at excessive money supply is the federal reserve’s balance sheet as a percent of GDP. It is one way to show the volume of funny money pumped into the system as a percent of the economy. We see why in 2009, I got nervous.
What’s Next?
Goldman Sachs’ head of hedge fund sales thinks central banks are ready to “break some things” to stop inflation. It’s like resetting a dislocated shoulder, except the necessary pain may last a couple of years.
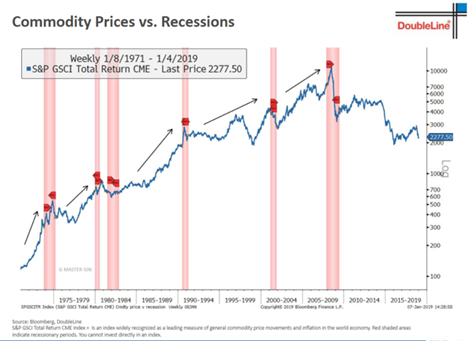
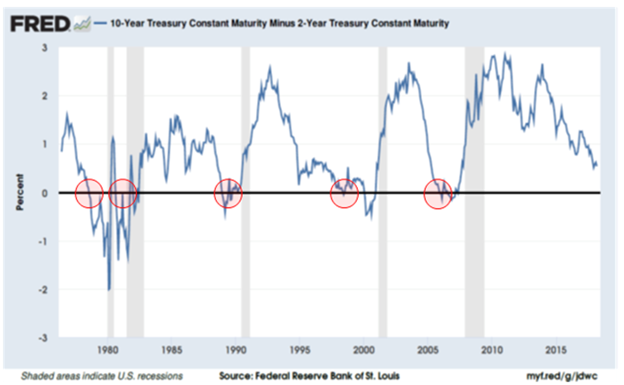
Past recessions were preceded by commodity price spikes that soon crashed in recessions. Recessions almost always occur when the yield curve inverts, as it did twice this year, including Monday, June 13. An inversion is when short-term interest rates are higher than long-term rates. Short-term rates rise in response to inflation and likely Federal Reserve rate hikes. Longer-term treasuries are slower to respond.
What does it mean for our industry? In my career, our industry zigged while the overall economy zagged. Coincidence? Probably not. We are more like the slow-moving 10-year note or 20 and 30-year bonds. For that, I think we can be thankful, but we will see.
[1]Source: The Wall Street Journal
[2] You’d think pie charts of EV battery materials would be everywhere on the innertube – not!
