
Michaels Energy was founded in 1984 in the wake of the 1970s energy crises when fear of energy starvation gripped the nation and world. Forecasts indicated natural gas and crude oil reserves would soon be depleted. Policymakers were so freaked out that, for a short period, natural gas was banned from new buildings, not for greenhouse gas reductions, but because we needed to save it for, I don’t know, manufacturing or something.
Indeed, Michaels’ first office building, located at 811 Monitor Street in La Crosse, was all electric, with a horrifically designed HVAC system with perimeter ceiling diffusers delivering heat to leaky exterior walls. If you’re always cold and like an auxiliary heater to stay warm at the desk, you would need a blowtorch or an electric arc furnace to stay warm in that building.
I assume Jim Michaels’ vision was to build a lasting line of business, saving energy in commercial and industrial buildings from an ever-shrinking energy supply and soaring prices. Well, that didn’t materialize. Twelve years later, when I joined the firm, I spent about five wandering the valley of the shadow of efficiency death in the late 1990s. Although electric utility deregulation in the 1990s was a sledgehammer blow to efficiency programs, it opened the door to utility merger mania, which sometimes included requirements for energy efficiency programs. That was our lifeline. We landed decades of work with one of my favorite clients, Alliant Energy. We were the ”OGs,” as one of their folks told me back in March.
The energy source of choice to get us through the 1970s crises into the 1980s was coal. Electricity generating capacity additions in the United States from 1950 through 2023 are provided in Figure 1 and Figure 2. Sorry, but you must use your three-pound organ to process the disparate data. Use it while it’s still better than an Nvidia chip.
Figure 1 Capacity Additions 1950-2015
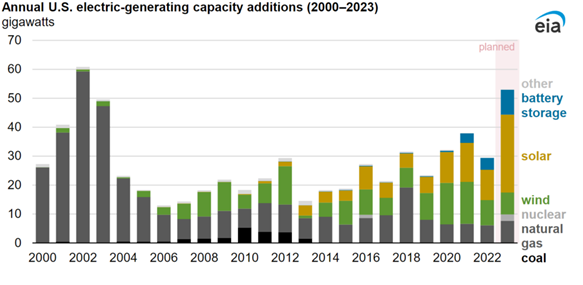
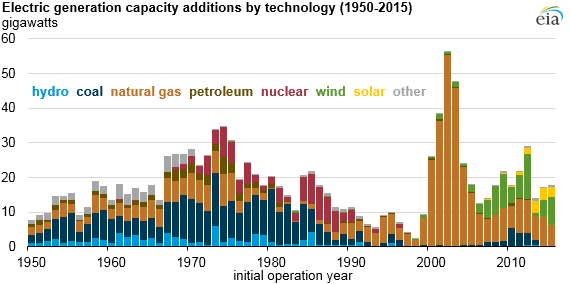 Figure 2 Capacity Additions 2000-2023
 Past Projects Forward
 Past Projects Forward
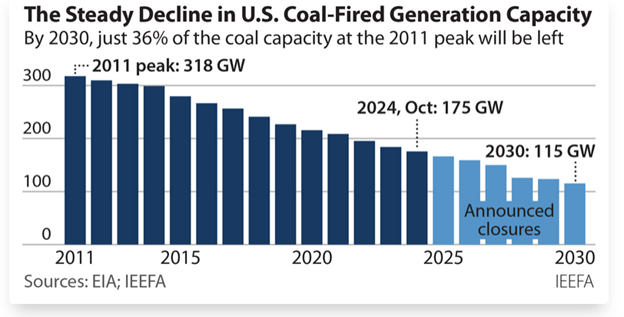
The purpose of retelling the journey through the last 50 years is to see what’s coming next. For 65 years, the U.S. added an average of 15 GW of dispatchable power generation in hydro, coal, natural gas, petroleum, and nuclear power plants. Coal plant capacity has been chopped in half from its peak, and is projected to be chopped to one-third by 2030, per Figure 3.
Meanwhile, for the last 20 years, the U.S. has added an anemic 8 GW of dispatchable power generation per year. This spells trouble to the current Secretary of Energy, Chris Wright.
Figure 3 Coal-Fired Power Plant Capacity
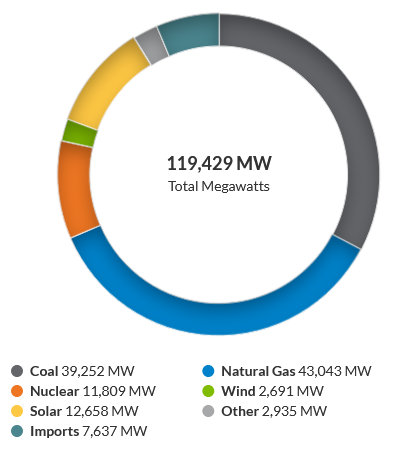
 I’ve written at least a dozen blog posts, going back at least seven years, describing how the massive buildout and reliance on renewable resources will increase electricity prices and squeeze reserve margins. One significant reason: full redundancy with dispatchable generation or batteries is required. For example, the Midcontinent Independent System Operator (MISO) footprint includes 31,000 MW of wind generation, but on Monday afternoon, July 28, 2025, has a capacity factor of only 8.7%. Coal is taking up the slack. August is the wind-starved month in MISO.
Figure 4 MISO Fuel Mix Snapshot
 A recap of Rants is provided in Table 1. Not included are my multiple Rant posts describing why the levelized cost of electricity production is a terrible guide for choosing an overall low-cost electricity generation and delivery system. See Planes, Bikes, and Automobiles, and the TRC Calling 1979.
Table 1 Bakers Dozen Rant Posts on Rising Prices and Decreasing Reliability
Rant Post | Date | Theme Summary | Link | |
1 | Avoiding a Downshift Tailspin with the ITC On Storage | 06/17/2025 | Erosion of reserve margins due to plant retirements and delayed storage | |
2 | Grid-Stabilizing Parts of the ITC Spared, For Now | 06/23/2025 | Risk of outages without dispatchable backup capacity | |
3 | Mini, Macro, and Mega Looks At the Modern Data Center Industry | 09/10/2024 | Soaring data-center demand draining reserve capacity | |
4 | Resilience for a Power Grid Green Swan Event | 03/15/2022 | Lack of redundancy and planning leading to unreliability | |
5 | Electricity Market Manipulation –Higher Costs, More Emergencies | 06/06/2023 | Capacity margins shrinking under deregulated markets | |
6 | Phony Avoided Cost Models in a Free-Agent Market | 10/11/2022 | Collapse of excess capacity and consequences for reliability | |
7 | Capacity Market v Energy Market –What's the Diff? | 03/01/2017 | Energy-only markets hurting reliability | |
8 | Energy Transition – Four Factors to Watch | 03/30/2023 | Renewables pushing grid toward instability | |
9 | Colors and Costs of Hydrogen vs. Natural Gas | 04/01/2024 | Loss of dispatchable generation reducing margins | |
10 | The Power Grid's Glide Path to Reckoning | 03/08/2022 | Retirements eroding capacity before replacement | |
11 | Reverse Efficiency Beatings with DRIPE | 11/30/2021 | Reserve margin norms & demand-response reliability | |
12 | 2022's Lucky Seven Lookback | 01/03/2023 | NERC predicts MISO shortage due to retirements | |
13 | The Rising Price of Less Reliable Electricity | 07/19/2024 | Rising costs and declining reliability as renewables displace dispatchable generation |
The DOE and Press Catch Up
I’m pleased that the DOE and the press are catching up with the reliability and affordability crisis. Welcome aboard the less for more train.
Earlier this month, the DOE released its report, Resource Adequacy Report Affirms The Energy Emergency Facing The U.S. Power Grid, which can be summarized in two grunts, uh-oh.
Capacity Crunch (Seems like a good name for cereal)
Metrics of the crisis include the following, keeping in mind that the current peak load on the nation’s grid is around 750 gigawatts (GW):
- Plant Closures: 104 GW of closures announced by 2030
- Overall Need: 100 GW of net new peak-hour supply required by 2030
- New Generation Needed: 210 GW projected additions — only 22 GW is firm, dispatchable power
- Data Center Demand: 50 GW of additional demand by 2030
In case you missed it, 104 GW of firm dispatchable power generation will be replaced by 22 GW of new dispatchable generation, for a net negative, mmm, 82 GW, while we need plus 100 GW. That equals a deficit of 182 GW on a 750 GW grid.
Yeah.
We don’t even need data center growth to have a crisis. That is less than a third of the 182 GW deficit. I would also suggest that the 50 GW data center load growth is low. Meta’s planned mega complex in Louisiana is a 5 GW load.
The DOE report notes, “The energy infrastructure industry, which is accustomed to moderate to zero load growth, needs to innovate to keep up with the demand.” That’s like calling in the pick axes and shovels to build the next Hoover Dam. Where have I read that before? “We have a generation of utility, regulatory, and policymakers who have never witnessed such growth.” The infrastructure industry is tied down by a web of RTO, state, interstate, and NIMBY Kevlar rope.
Pricing Pressure
Meanwhile, Heatmap also jumps on the train, reporting that The Electricity Affordability Crisis Is Coming. They refer to a Powerlines document stating that utilities have asked for $29 billion in rate increases so far in 2025. Utilities typically land about 75% of their proposed rate increases. However, that does not include pass-through capacity charges like in PJM, which are automatic. For reference, the national electric bill is around $500 billion per year, and therefore, annualizing the proposed rate increases, and throwing in pass-through capacity charges can easily achieve a 10% increase in the cost of electricity.
Immediate Solutions
Utility Dive reported that during the late-June heat dome, virtual power plants, or VPPs, which aggregate electric loads to match supply, helped save the eastern interconnection, particularly PJM and the NYISO. However, as the article suggests, VPPs need to scale much faster and capture much more commercial and industrial load.
More broadly, net load growth will quickly blow through the capacity of nuclear power plants coming out of retirement, and the DOE’s use of section 202(c) of the Federal Power Act to keep power plants on line in lieu of retirement.
RTOs and utilities need to raise arbitrary price caps on capacity to spur rapid growth of load management and demand response for VPPs. The alternative is a 100X increase in the probability of grid outages and 800 hours of outages by 2030.
Hello?