
In this week’s Energy Rant, we’re covering part three of good, perfect, and real carbon targets.
In Part I of this series, we examined how various storage technologies work, their pluses, and minuses. In Part II, we put numbers to generation and storage technologies, including maximum power, duration of discharge (for storage), cost per megawatt and megawatt-hour to build and operate, and a slew of other great stuff. In Part III, we will size up the numbers from Part II to actual grid demand. The objective is to provide scale to see what we would need to pair high percentages of renewable and storage to what the grid actually uses.
Let’s start with the regional transmission organizations (RTOs) and independent system operators (ISOs); synonymous terms for the same thing. These organizations are balancing authorities that keep the lights on by triangulating to use the lowest-cost resources to power the grid at all times. I believe the map below is the most current. I live in the MISO (Midcontinent Independent System Operator) region, so I know some ISO features through conversations with utility folks. One is, ISOs facilitate renewable energy production through day-ahead auctions. Frankly, for areas without ISOs, I don’t know how they deliver the lowest-cost electricity.
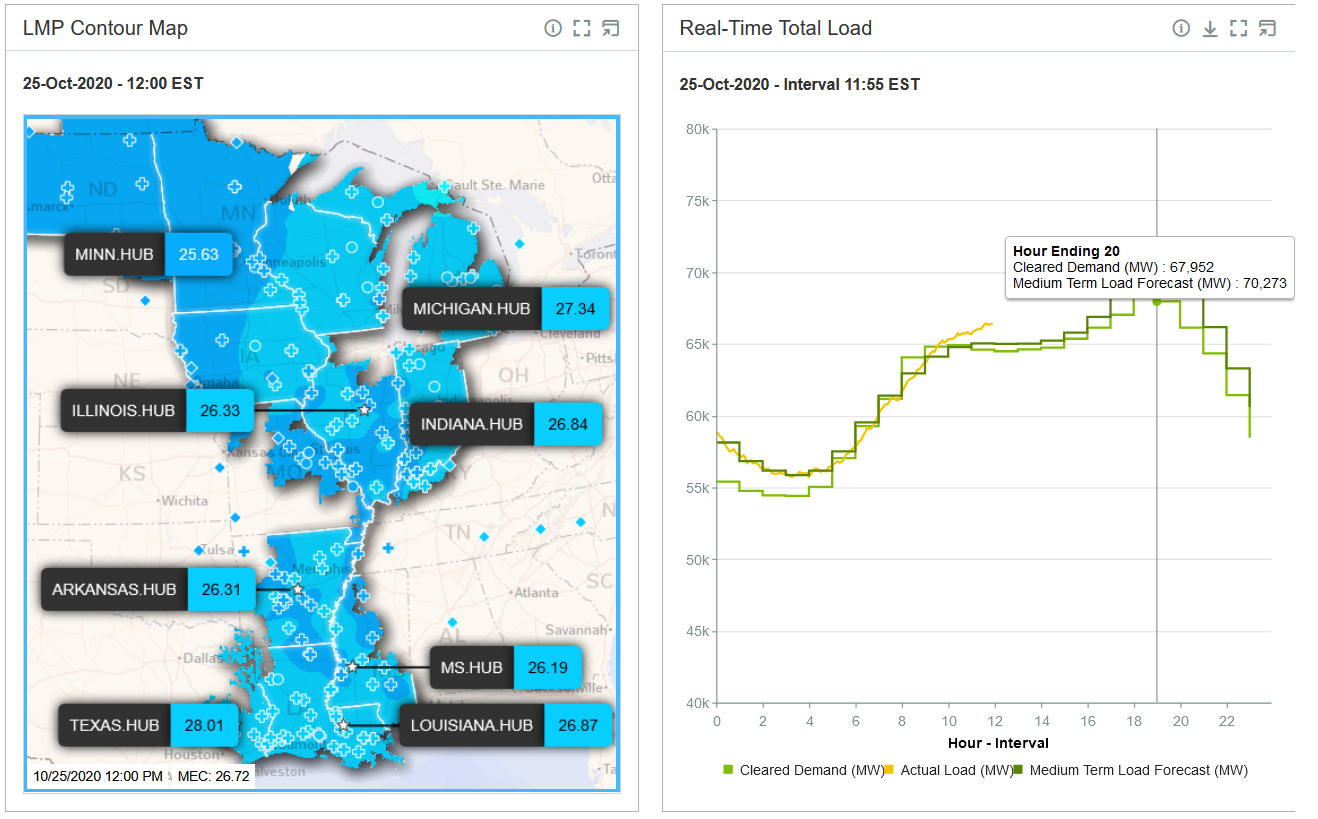
The next figures show real-time LMP (locational marginal price) on a Sunday noon. Conditions at this time are boring, but things get much more colorful in the summertime.
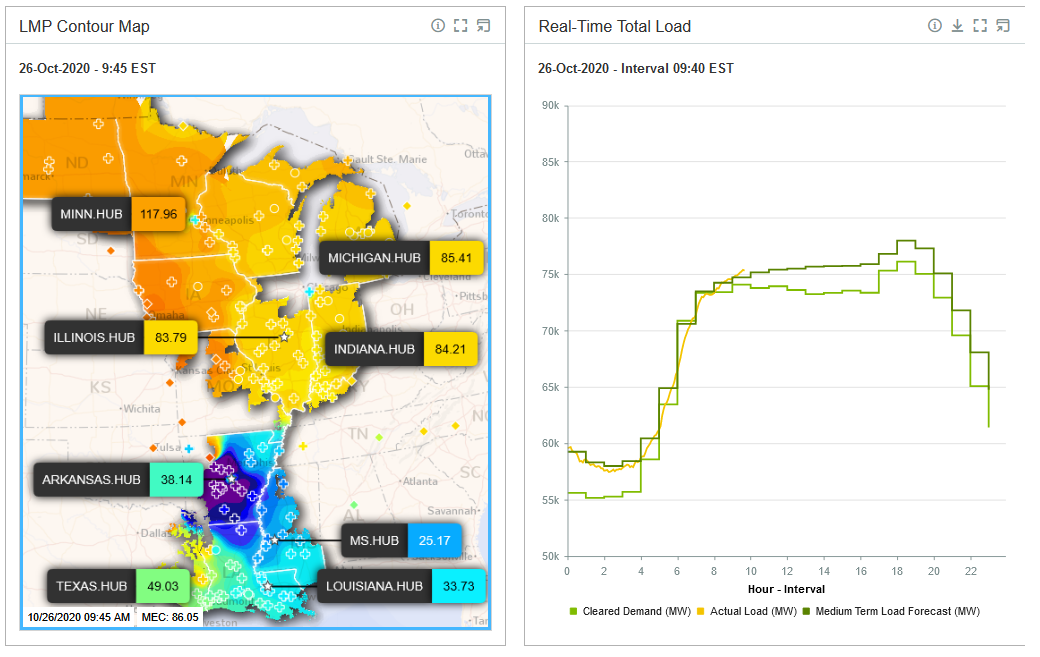
Monday morning, things changed. I can look at that and guess the wind isn’t blowing in Western Minnesota and Iowa / Eastern Dakotas. That is correct. The reported wind speed is four mph in NW Iowa, and therefore, prices are higher than average. Sunday, it was blowing 15 mph with about a 10,000 MW lower load. Higher supply; lower demand; lower price.
I’m not an electricity bidding expert, but I can fake one. Generators bid megawatts for every hour or fraction of an hour for the next day, or day ahead. The cheapest resources are always used first. When supply matches demand, the market is “cleared,” and the price of the last resource to offer in (plus other market operation charges) becomes the wholesale price of power[1]. The cleared demand curve is choppy, I would say, as each step represents a new resource being cleared to supply electricity.
The ISOs are critical to providing “transparent and liquid[2]” markets for renewable energy trading through regional transmission access to these renewable resources.
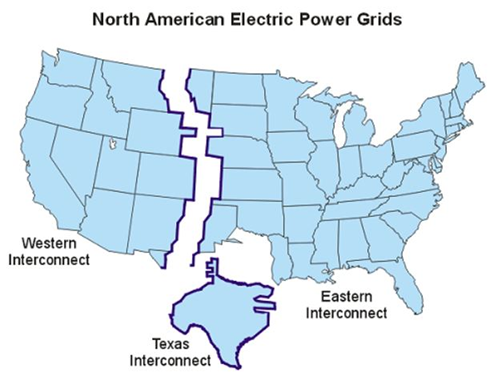
ISOs and RTOs establish ways for markets to keep prices low, but they are limited, as shown in the map above. However, the U.S. grid consists of three islands shown below. There is almost no exchange of power across the chasms, or “seams” as they are also known. So what? The seams block the transmission of renewable energy. If we want to expand the use of renewable energy, we need huge pipes from east to west and north to south, in addition to establishing ISOs in the West and Southeast. This would obviously increase renewable energy consumption as the wind is always blowing somewhere, you would think. I don’t know what that’ll cost, but I’ll guaran-damn-tee it will be a tiny fraction of the storage costs we looked at last week. Not only that, it is physically possible to build these systems and it maintains our energy independence – rather than relying on exotic minerals and metals from all over the world – stuff we do not have.
So you have to be asking yourself, as I am, why the three islands? I can’t find the answer to that. Was it planned? Was it dumb luck?
The monopoly grid with interconnecting generation started in Chicago when Samuel Insull began linking generating assets to provide greater utilization, more reliability, and of course, make more money. He had to trade all this for regulation. Did the three interconnections balloon until they reached each other? In one case, ERCOT (Texas), the answer is no. Texas has its own grid because they don’t want to be under the thumb of Washington. Since power doesn’t cross Texas’ state lines, the feds have no jurisdiction.
Don’t Cross the Seams
These giant grids share very little power because each is synchronized to its own 60 Hz waveform. That means their voltages are far apart at any instant, and when conductors with different voltages collide, explosions happen. A solution is direct current, which doesn’t have time-dependent voltage. It’s constant.
For reasons I don’t have time to learn right now, alternating 60 Hz current was chosen because it’s easy to step up voltage for transmission over long distances, and then stepping down, for use in homes and buildings. Alternating current (AC) was also chosen because direct current (DC) lines are only good for a mile or so, and their losses become too great, at least back in Insull’s day.
The only connections between the islands are minimal DC lines – 1,300 megawatts[3], which is practically nothing. AC power is converted to DC, transmitted across the seam, converted back to AC, and synchronized with the interconnection.
Engineers have figured out how to transmit DC power over long distances with miniscule losses. Introducing, the “Seams Study,” a National Renewable Energy Laboratory (NREL) project that started in 2016 to examine the costs and benefits of nationalizing grid, at least, east and west, into a “super-grid.” Objectives include better reliability and market access to cheap power.
According to transcripts from a podcast with the Institute of Electrical and Electronics Engineers, the Seams Study has been suppressed. This seems to be a common political tactic these days. Interviewee Peter Fairley says a particular pro-coal administration is suppressing the report. Interestingly, Fairley states other political forces, like those behind efficiency and weatherization programs, are holding up the Seams Study.
But wait a minute, if we do efficiency BEFORE the DC super-grid, what does that look like? This feeds my theme that efficiency is falsely NOT considered a resource. It’s what we apply to the circumstance at hand – i.e., build stuff and then see if efficiency is cost-effective after those other costs are sunk.
Next
Sometimes there is more to unravel than planned, but I will get this wrapped up next week for sure!
[1] https://learn.pjm.com/electricity-basics/market-for-electricity.aspx
[2] files.brattle.com/files/5733_the_role_of_rto_iso_markets_in_facilitating_renewable_generation_development.pdf
[3] You can see above that MISO alone, on a cold October day, demands about 75,000 megawatts.
