
Grid reliability issues are upon us, and they will become more severe and disruptive in the next 10-20 years. But first, why is this happening? If governments mandated things in medicine[1] as they do with the grid, they would declare that chemotherapy will phase out by 2030 and cancer will be cured by 2035. Period. Because they said so. Meantime, we will have to deal with the deleterious effects of forced fantasies, so let’s get to work on that.
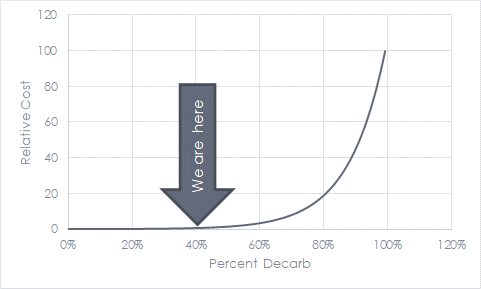
The transition to high penetrations of renewable energy will increase in cost exponentially, as I wrote a year ago in Answer: Avoided Cost. What’s the Question. In that, I shared an analysis provided by the Massachusetts Institute of Technology showing a curve that looks like this:

 MISO’s Story
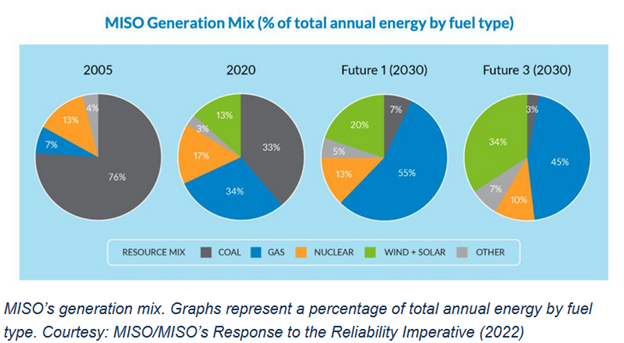
As I cut pieces to fit into the decarb puzzle, I studied a more comprehensive analysis provided by the Midcontinent Independent System Operator (MISO) in a report titled (the) Renewable Integration Impact Assessment (RIIA). The chart below, showing past and forecast electricity supply sources, is essential to set the stage for the RIIA report.
I recently mentioned that MISO’s capacity auctions have historically been yawner events because there were plenty of connected, dispatchable thermal power plants. MISO projected generation shortages for this summer, and the auction resulted in a clearing price of $236.66 per MW-day. What’s a MW-day? It is the measure of pricing capacity, and in this case, it is the CONE, or cost of new entry, which is the annualized cost of building a new power plant. Per my calculations, that is roughly equal to $2,600 per kW for the life of a power plant.
Hmm. Things are getting real now as we see the value in demand-side resources to avoid outages. Or what about shutting down thermal power plants to “save money?”
We see that recently, renewable resources, nearly all wind, represent only 13% of MISO’s generation and that forecasts for 2030 vary from 20-35%. What will that look like for the grid and customers in MISO’s territory? MISO’s RIIA study posts results and discussion of four levels of renewable penetration, in percent of total kWh from renewable resources – wind and solar.
Note: MISO describes the scenarios below in the present tense, so I stayed with that.
10-20% Renewable
MISO reports that there are already pockets of overgeneration of renewables at a mere 13% penetration. Transmission constraints drive electricity prices below zero at times in some places because wind generators get the production tax credit, and it costs thermal plants more to shut down and restart than to generate power and pay customers to take it.
As solar generation increases from negligible amounts today, it creates capacity issues as the supply drops sharply while the sun sets, but loads remain high – as I explained in Tiger by the Tail.
20-30% Renewable
MISO anticipates 20-30% renewable resources by 2030. MISO’s description of this reminds me of the depletion of nuclear fuel. As U-235 fissions, a spectrum of daughter elements results, and some of those elements are gaseous. If they cluster excessively, the small gaseous pockets, like pockets of renewable generation on a map, grow into one another and cause a blister. Blisters are nasty because they can deform fuel, disrupt channel flow, and if they grow too large, they rupture, releasing decaying radioactive material into the coolant.
 Pockets of overgeneration by renewable resources similarly fester and cause more significant issues as clusters converge into larger blisters. This will happen when renewable blisters in western Iowa and Minnesota run into solar blisters in eastern Minnesota and Wisconsin. It’s on the way.
30-40% Renewable
At 30-40% penetration, renewable generation reaches 100% for the region[2], and lots of renewable generation must be curtailed (thrown away) in blistered subregions. Vast amounts of transmission are needed at a price of two to four million dollars per mile[3]. Blistered subregions are dumping renewable energy at times while importing from other sources (thermal) at other times. Net ramping loads from thermal sources grow considerably for morning and evening periods, requiring additional curtailment to manage ramp cliffs and walls (see below – California today). In many ways, MISO balancing authorities will have a more difficult time matching supply with demand than CAISO will have. MISO must accommodate radical gyrations in wind generations, especially in spring and fall when the wind blows hardest and electric loads are low.

40-50% Renewable
At 40-50% renewable generation, renewable resources frequently meet or exceed loads. Voltage and frequency control becomes difficult because electronics regulate supply rather than spinning machinery (turbines) that naturally regulate frequency and voltage. Stability is a challenge – like sliding down a steep hill on ice in a car or controlling a canoe in class-five rapids with a two-by-four.
Additionally, MISO writes, “the system now experiences common long-distance power transfer patterns, as economic dispatch tries to maximize the use of low-cost generation to serve regional load. These changes lead to very different reliability risks than are experienced today.” The cliffs and walls become more intense in small pockets, requiring local thermal generation to keep the refrigerator cold.
Next Up
Next week we will explore net load implications of solar and wind and how we can mitigate the risk of disruption and outages.
[1] Well, some already have with, at best, imperceptible positive impact.
[2] The report uses the term MISO region multiple times elsewhere, but not in this specific case. I presume this region is synonymous with MISO region.
[3] https://cdn.misoenergy.org/20190212%20PSC%20Item%2005a%20Transmission%20Cost%20Estimation%20Guide%20for%20MTEP%202019_for%20review317692.pdf
