
This week, we finish the series on attribution studies. First, let me explain, while I beat up attribution assessments, they are necessary. This post will conclude with how I think they should be used.
Experimental v Quasi-Experimental
Second, I want to make a couple comments about last week’s post. Near the end, I explained randomized control trials (RCTs) for determining attribution. Test samples need to be drawn before the attribution study using the RCT. Correct me if I’m wrong, but this never happens when determining the attribution of an efficiency program. The attribution study always occurs after, or at best, during, deployment of the intervention.
Therefore, a quasi-experimental[1] approach is used when studying the impacts on populations. A quasi-experimental approach involves drawing samples using matching techniques. The Kwik Trip Cheese Mountain pizza experiment I derived two weeks ago used “propensity score matching,” which is selecting two populations with similar observed characteristics.
So, we can see, to do a true randomized control trial, one practically needs placebos or caged animals housed in separate identical and sterilized buildings.
To that end, using an RCT on the thermostats, as discussed last week, is not an attribution study whatsoever. The RCT used for home energy reports is much closer to an attribution study. In that case, home energy report Information is provided to homeowners, and they do what they do. They did not choose to receive the home energy reports and therefore, the “why” is solved. If the needle moved, while accounting for weather and a zillion other observable issues, it was because of the home energy report AFTER the effects of other program interventions are accounted for.
- What about the economy, which changes behavior?
- What about snow days, like the dozens of which we had in Wisconsin this year? That has a huge impact on home energy use.
These are just a couple examples of observable issues, yet they are practically unquantifiable, short of guesswork.
These fashionably named experimental, quasi-experimental, and propensity score matching only apply to mass-market deployment in the residential/consumer sectors.
Self-Delusion and Guess
For commercial and industrial programs, our good friend Phil Willems found in a 2017 study that:
“Instead [of something good] the NTG landscape remains a patchwork of methods and policies where most jurisdictions use the same self-report technique that they and their consultants recognize as flawed. [my emphasis] Self-report may not be best practice, but it is standard practice, used by most jurisdictions.”
That is the wild west. We engineers are frequently harangued for estimating energy savings. E.g., if five engineers estimate savings for an HVAC system replacement, there will be five different answers. However, there are no bounds on energy calculations. Savings could be negative or well into the eight figures.
Attribution dart throwers have guardrails of 0.0 and 1.0 (or slightly more than 1.0 if delusive pixy dust is used in the analysis). Furthermore, there is a strong social norm to calibrate the results to numbers everyone else is getting. Beyond that, it is heavily influenced by pressures applied by regulatory bodies.
Compliance Behavior to Social Norms
The self-report technique mentioned by Phil involves asking program participants what they were thinking, on a cold rainy day in November, 16 months ago. This is where the bias landmines discussed last week enter the picture, particularly compliance behavior.
Programs build a ton of attribution over time, but it seems we take only the marginal attribution and then apply fudge factors. Consider market transformation, which changes the norm for purchasing and activity from less efficient to more efficient.
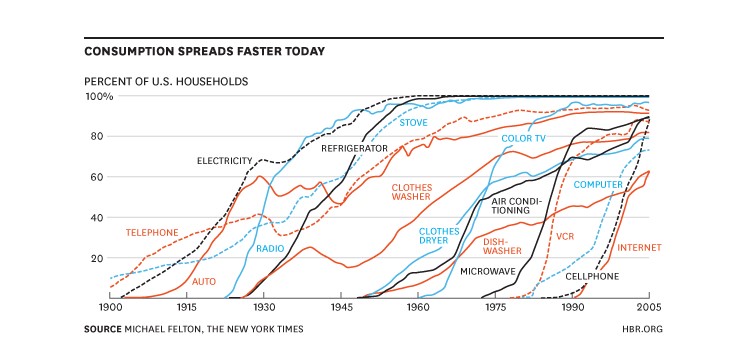
The lighting game has been transformed to LED. Nowadays, I can hardly imagine anyone buying other than an LED. The color spectrum is vast. They last forever, and they are cheap. The attribution for accelerating the adoption curve is great, close to 1.0. The curve without programs might look like the clothes washer curve in the chart below. With programs, it looks like the color TV curve. I will write about market transformation programs soon.
Applying Attribution
What should we use attribution for? Should it be used to adjust savings that a program is granted? No! Again, I compare to supply-side resources. Do utilities get hit with free ridership penalties for overbuilding supply or transmission systems? No. We have an oversupply of generating assets in the MISO region. Generating plants are being retired before they reach the end of their useful lifetimes. Why is this? Because new assets can be built (to generate profit) while maintaining prices at reasonable levels. Working assets are retired because they have been replaced with new assets.
It also occurs because load growth forecasts are always wrong, and it takes half a decade to get dispatchable generation[2] built. The lights must stay on so there is upward fudging on the loads, in addition to earning more money for building more stuff.
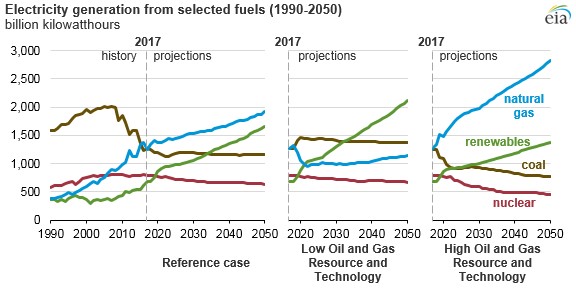
Load forecasting is also strongly biased by what happened in the recent few years and extrapolating 20 years forward. Consider the following EIA chart. Miraculously, the forecasts for the next thirty years extrapolate what’s happened in the recent few years.
Utilities are not penalized for wrong load forecasts, so why should efficiency be penalized based on biased guesses for what people were thinking 18 months ago? The great Tom Eckman states, attribution merely measures how the cost of the resource is distributed across society. I add that the cost of supply-side resources is not equitable either. To make it so, prices would necessarily rise for society as a whole. Think about that a while.
[1] As opposed to the experimental RCT.
[2] Non-dispatchable renewable generation gets approved with no pushback.
