
In the last two Rant posts, we learned that our 40-year-old program evaluation frameworks need to change to capture greater, real impacts. Rather than improving programs and accurately determining impacts, archaic evaluation methodologies are impeding progress toward greater energy savings. It may be like solving the percolating national debt crisis, but I will attack this rubber tree plant anyway.
Attribution
Determination of program attribution is the common thread that weaves through most of the six common flaws (described here and here) of current program policy. Attribution is the quantity of benefits[1] delivered by the program or intervention. Attributable impacts are those that would not have otherwise been realized. For example, the sunrise is zero percent attributable to the rooster’s crow. It is 100% attributable to the earth’s rotation.
This got me thinking, how do evaluators outside the energy efficiency industry measure and use attribution? Does it even exist outside our industry? The answer is yes.
Definitions
First, noting the definitions of net savings and gross savings is appropriate. They are as follows, per the NREL Uniform Methods Project, which applies to our industry:
- Net savings: The difference in energy consumption with the program in place versus what consumption would have been without the program in place.
- Gross savings: The difference in energy consumption with the energy-efficiency measures promoted by the program in place versus what consumption would have been without those measures in place.
The ratio of net savings to gross savings, or net to gross, is commonly used in our industry to describe the savings attributable to the program, aka, intervention.
NONIE
I used the NONIE[2] in my assessment of how our industry compares to best practices elsewhere with regard to attribution.
To determine attribution, both our industry and the NONIE approach attempt to determine what would happen without the program – the counterfactual. The precision of the counterfactual is probably three to five times wider than the precision of the factual. In other words, we can quite confidently measure what happened. What would have happened is a much broader crapshoot.
For example, the Philadelphia Eagles were cruising through a great season in 2017 when their superstar quarterback, Carson Wentz, went down with a season-ending injury. What would happen without Carson Wentz? I would bet they will coast into the playoffs and lose because they have “nobody” with a track record of success on the bench. It was probably 4:3 odds that I would have been right, but of course, Nick Foles, the no-name backup, kicked holy butt and they beat the Patriots in a great Super Bowl win. The counterfactual, and thus, net-to-gross, is very imprecise. It is equal to predicting a fake future.
Introducing: Contamination
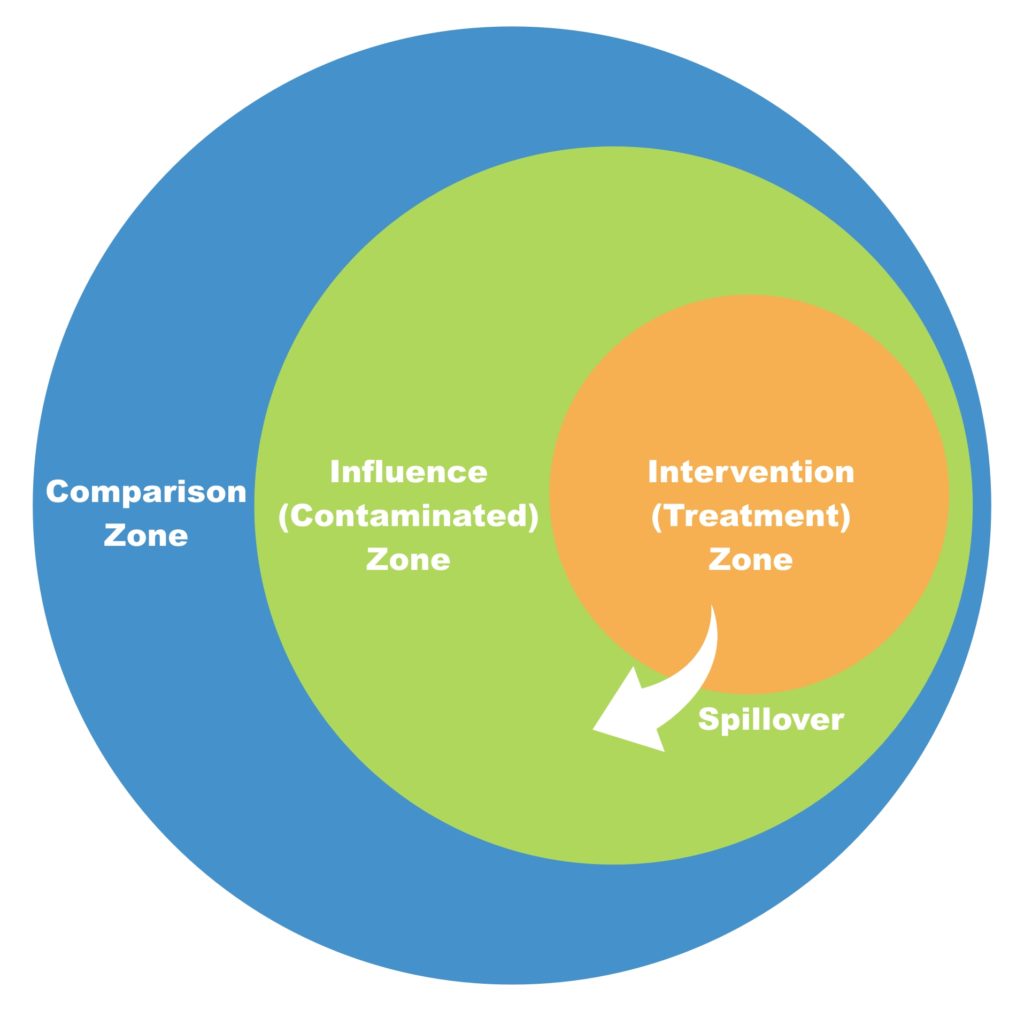
How does NONIE approach this? I learned from NONIE there are three zones of interest when determining attribution. They are shown nearby, and they represent physical proximity.
In our business, the intervention zone is the population of customers subjected to the intervention; e.g., a utility service territory. In our business, the influence zone (aka, the contamination zone per NONIE) includes neighboring areas where contractors working in the intervention zone also deliver services. Or, the influence zone may include consumers getting information from or taking advantage of offers in the intervention zone. The comparison zone[3] is almost entirely isolated from the intervention zone.
To appropriately determine attribution, one needs to move outside the intervention zone, beyond the contamination zone, to a comparison zone. Give me an example, Jeff.
True Best Practice
Kwik Trip, a La Crosse-based progressive convenience store chain, wants to know how effective a sale on Cheese Mountain pizzas impacts in-store sales of pizza and other stuff. Should they use Onalaska, which borders La Crosse, as a comparison group? No. Onalaska is contaminated. Those customers come into La Crosse stores, find flyers lying about in the break room or dentist office, and they hear or see ads on radio or TV. Therefore, Fox Cities is used as the comparison group. The population, income levels, demographics, colleges, and universities are very similar to those in La Crosse – but for all practical purposes, they are totally isolated from the La Crosse market and thus would serve as an excellent comparison group.
There are lots of differences between NONIE, my example immediately above, and the way net savings are determined in our industry. In all ways I can think of, we produce results that are poor by comparison. Why? Budgets, but as usual, I’ll explain some differences and next week, I will provide some suggestions.
First, as you see in the cartoon above, NONIE defines spillover actions, taken by people in the contaminated zone, as a result of activity in the intervention zone. An example is Minnesotans coming across the river and stealing our Wisconsin discounted lightbulbs. In our industry, this is called leakage. Everyone else calls it spillover.
In our industry, spillover occurs within the treatment zone. It is customers who don’t file paperwork or log onto a website to collect their herring[4], but they implement efficiency anyway. How is it determined? I’ll get to that next week. However, if it can be done right, as in the Kwik Trip example, there is no spillover.

Free riders are another crap shoot (my emphasis on crap). This, of course, occurs when the brilliant, virtuous, or thrifty specimens take treatment, in our case, money, out of the system for things they are going to do or buy anyway. When using the NONIE path with a comparison group, free riders drop out. To wit, people jonesin’ for a Cheese Mountain pizza in the Fox Cities are in the same proportion to those jonesin’ in La Crosse – no hokey self-report biased by egos, virtues, or tightwaddedness required.
We will continue next week.
[1] kW, kWh, or therms in our business
[2] NONIE is a Network of Networks for Impact Evaluation comprised of the Organisation for Economic Co-operation and Development’s Development Assistance Committee (OECD/DAC) Evaluation Network, the United Nations Evaluation Group (UNEG), the Evaluation Cooperation Group (ECG), and the International Organization for Cooperation in Evaluation (IOCE)—a network drawn from the regional evaluation associations.
[3] A comparison group is used as the baseline group, and they serve to determine the counterfactual, “what would have happened”.
[4] Herring equals money to the clapping seal.
