
This week, we are continuing our dive into attribution, which is the impact an intervention or program has on a population – in our case, efficiency programs in a service territory or state.
Last week, I used the term comparison group rather than control group. They can be used interchangeably and sometimes erroneously. A comparison group is a baseline to observe what happens in absence of intervention. It avoids guessing counterfactuals and unobservables altogether.
The Unobservable
My example of a comparison group was Fox Cities, WI to observe the impacts of a pizza-promotion intervention in La Crosse, WI. For purposes of the study, the populations are completely isolated, but otherwise, have the same demographics. Determining attribution in such a case is easy because the observed baselines are the same. But, not everything is readily observable. For example, what if there is an ice fishing tournament on Lake Winnebago during the intervention, and it isn’t observed by the evaluator. Uh oh. That’s going to have a significant impact on convenience store sales. Is this an observable or unobservable factor? It is as you see nearby, but the evaluator has to be looking to discover it.
From the point of using reliable comparison groups, we move to the guesswork of control groups in the contamination zone, where the effects of efficiency programs are influencing unobservable forces and thought constantly. Our industry relies almost exclusively on participant and non-participant self-reported thought and activity.
These unobservable forces and biases are impossible to quantify with tighter confidence intervals than halfway to zero or one hundred percent[1]. For example, if attribution is determined to be 70%, the true answer might be between 35% and 85%. If it is determined to be 90%, it might be between 45% and 95%. In our industry, attribution is more of a shade than a ridiculous collection of discrete numbers.
To wit:
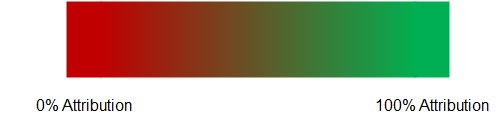
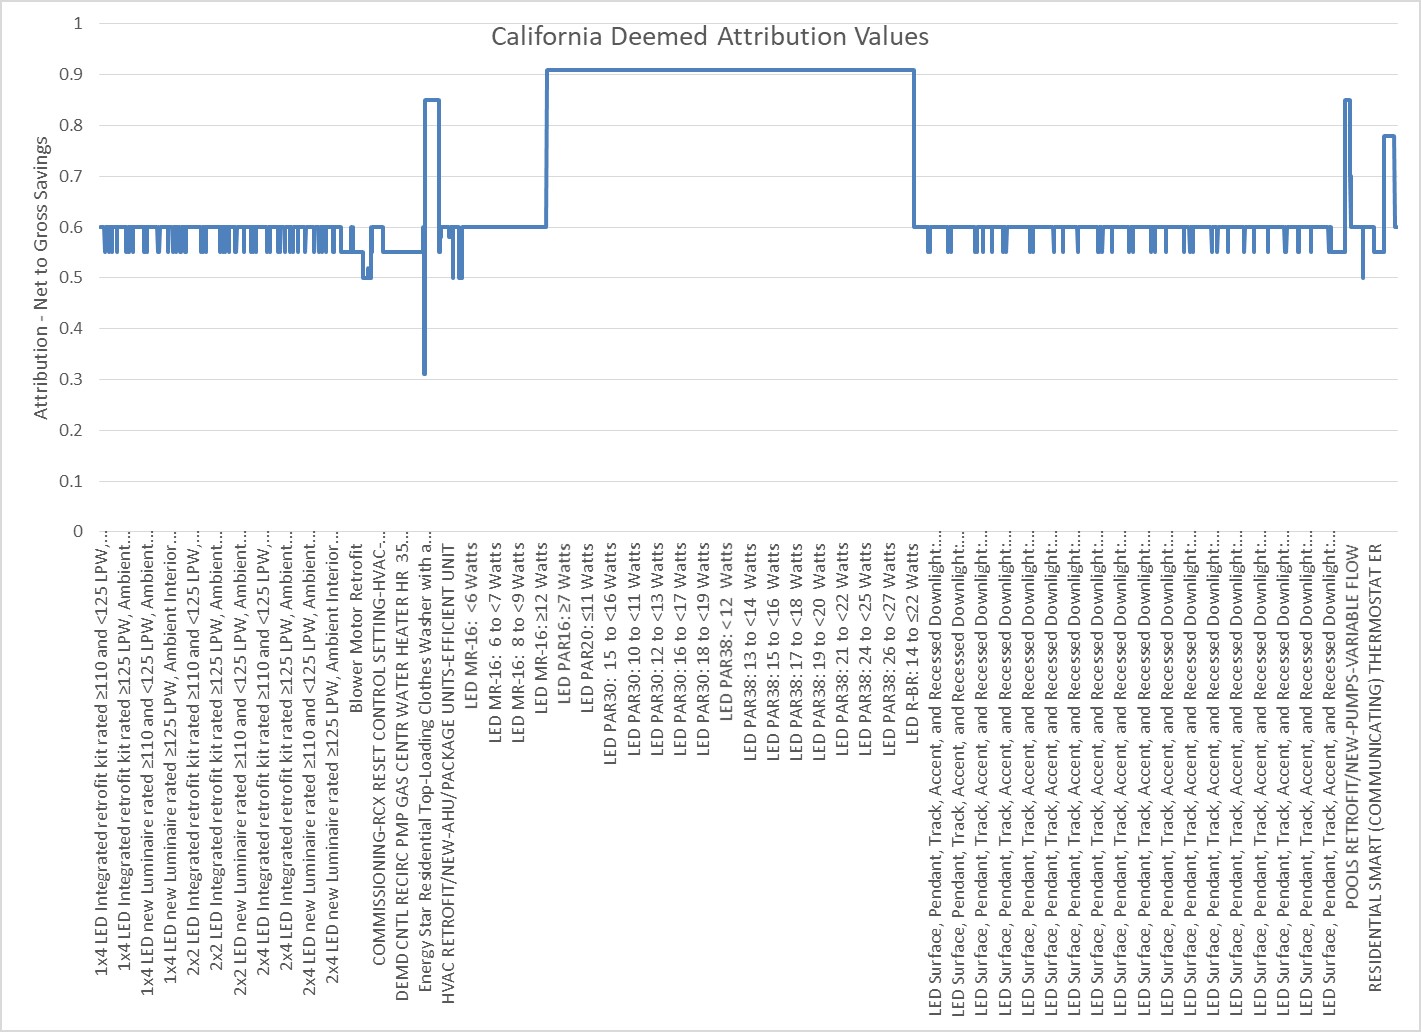
Rather than discrete assignments discussed here:
Let’s examine some of these unobservable, and therefore, unquantifiable factors that are partly, unconfidently, factored when pinning the efficiency-attribution tail on the donkey. These factors have varying influence on efficiency-program attribution estimates because most programs involve the clapping seal model[2]. Different influences would apply to information-based programs.
Compliance behavior – In short, compliance behavior biases the specimen to provide answers the evaluator wants to hear or ones that are socially preferred. Folks, people have a hard time telling the doctor the truth when their own self-interest is on the line. Do you think they are going to tell a stranger with a clipboard the truth?
Compensatory equalization – This issue explains the scorned participant who may participate as an act of retribution to “get their money back.”
Compensatory rivalry – Another phrase for this factor is keeping up with the Joneses. If my coworker dupes a program to get $75 for buying a smart thermostat by lying about his primary heating fuel, I gotta get me some too! Notice, in either case, the program is not working as designed, at all.
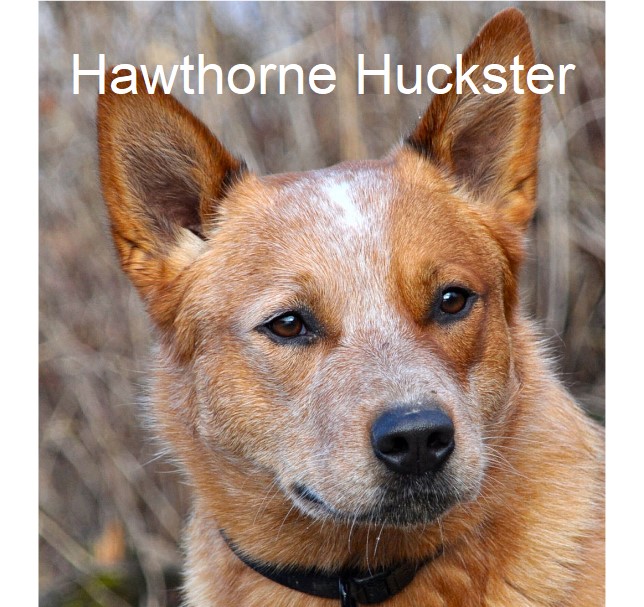
Hawthorne effect – The opposite of the Hawthorne effect is doing the right thing when no one is looking. Our Red Heeler, Brandy, during my time on the farm, was smart enough to pull this off. As I disappeared around the corner of the barn, she would go back to harassing livestock. As I peeked around the corner so she could see me again, her head would lower as she comes toward me. Bad dog! She knew right from wrong, although some people certainly do not!
Bias Compensation Strategies
Due to the above effects, evaluators deploy strategies to avoid or mitigate their contaminating effects.
Randomized Control Trial
In our industry, a randomized control trial, or RCT, compares participants to non-participants. This does NOT determine attribution in the efficiency world. Randomized control trials in our industry are used with large populations of participants and non-participants; e.g., homeowners. Our RCTs compare energy consumption of the treatment groups (participants) to consumption of control groups (non-participants). This has nothing to do with attribution, which is, “why did you participate?” Examples:
- I am a participant because I took a $75 rebate for a programmable thermostat I would have bought anyway, and now you are comparing my energy consumption with a control group, or myself before deployment. This has nothing to do with WHY I purchased the thermostat, which is what attribution is.
- I use my home energy reports to light the fire in my woodstove. Attribution: zero, or maybe 100%. I don’t know.
To be clear, these examples are used to determine gross savings, not attribution.
RCT As Intended
Proper deployment of RCT for determining attribution requires that samples be drawn BEFORE the population is subjected to treatment. Accurately determining attribution is still very challenging because of contamination effects.
As an example, let’s apply an RCT to a retail lighting program. Before launch, select a control group of 1,000 customers and a treatment of 1,000 customers. Now deliver mailers to the treatment group and see what happens. Even this seems like a simple and safe way to accurately determine attributable savings, but there are plenty of land mines.
Contamination is still a risk. Some mailers may make their way from the treatment group to the control group. Therefore, like the pizza case, the samples need to be sufficiently, proximally separated to avoid contamination.
Next
We will continue with attribution and what to do about it next week.
[1] My conservatively, humble, and correct opinion.
[2] Taking money for activity that is less and less dependent on scarcity of funding.


Join the discussion One Comment