I recently researched many attributes and market effects for liquid fuels for a project we are working on, and like my digging into the wind and climate studies, this research results in several findings. This post covers ethanol and gasoline blends. A future post will cover fuel cost and impacts on electric vehicles and utilities.
My journey began with the ethanol market. We produce a lot of corn-derived ethanol here in the northern plains. By 2020 there may be a big demand for Midwest ethanol as California caps the carbon intensity of its liquid fuels. The cap, part of their low carbon fuel standard (LCFS), seems to be working, so far, so good.
The standard is to reduce lifecycle carbon intensity from well to wheels, or cornrow to wheels, or former-rain-forest-to-sugar-cane-farm to wheels by 10% over ten years, ending in 2020. This sounds pretty easy, but it is not — the standard accounts for net carbon emissions for everything, including farming, fertilizer, feedstock transportation, fuel manufacturing, and fuel transportation, to list a few. It also accounts for carbon reductions as with bio-based feedstocks that soak CO2 from the atmosphere.
All(most) Solar
All energy, except nuclear, originates with the sun: wind, rain (hydro), plant material that is fossilized into coal, natural gas, crude, and of course, renewable solid (wood), liquid (ethanol/biodiesel), and gaseous (biogas). Nature and man simply reconfigure the Cs, Hs, and Os around forming useful renewable hydrocarbons and then burn them to generate heat, power, CO2 and H2O.
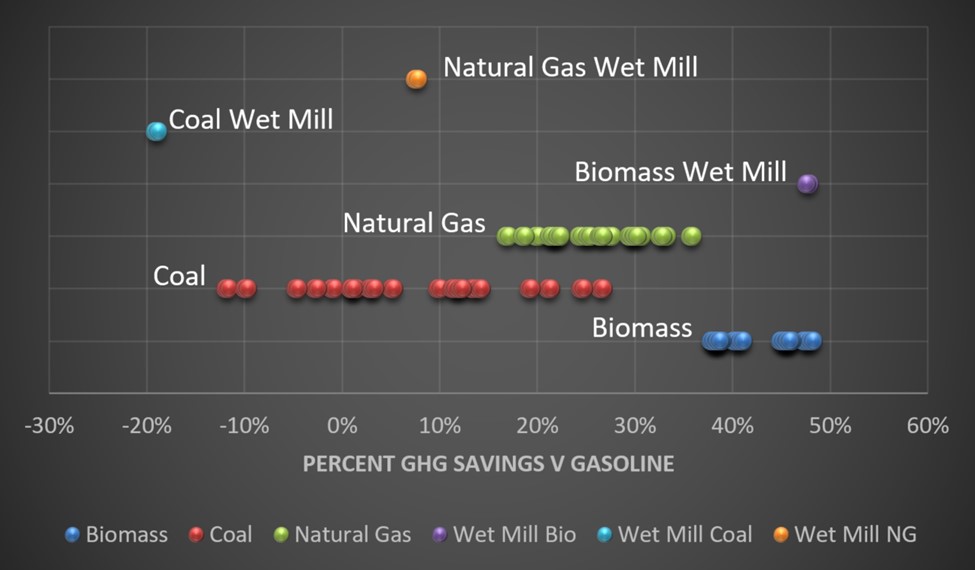
The EPA shows ethanol, for example, may be no less carbon favorable compared to gasoline for an ethanol plant that burns coal for its production process. Biogas fired ethanol plants save about 50% carbon emissions compared to gasoline, and natural gas-fired plants save about 20% v gasoline.
Reported life-cycle carbon comparisons to gasoline are shown in the following chart.
Inelasticity of Carbon Content in Liquid Fuels
When considering that ethanol blends are 10-15% at the pump, the fact that ethanol has 20%-50% lower lifecycle emissions doesn’t move the needle much. One could say there isn’t much elasticity.
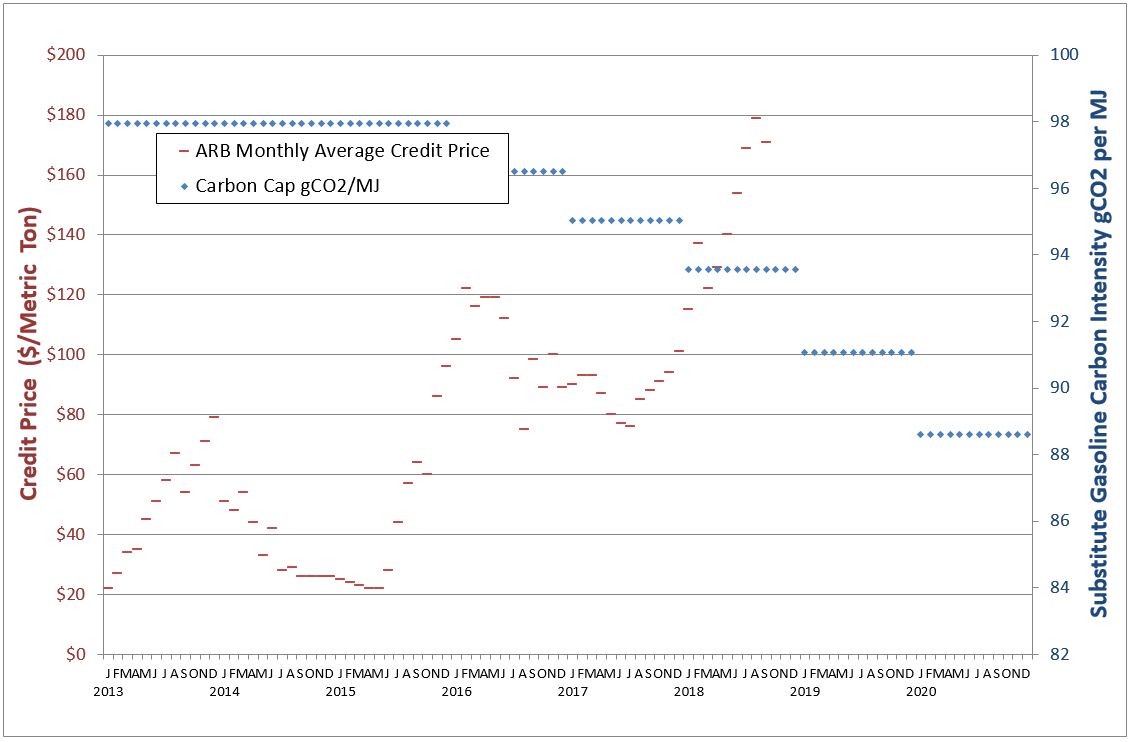
The chart shows California’s carbon credit price versus time for the standard. I added the carbon cap in the blue diamonds (right axis). The carbon price seems to be very sensitive to the cap, which as you can see, dropped a lot the past couple years, and will again in 2019 and 2020.
Hard Top
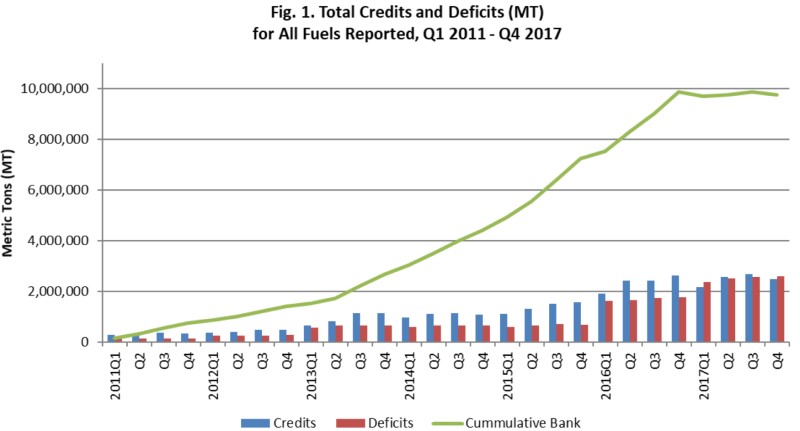
Below is a chart of accumulated credit volume. The plan was to accumulate credits in the early years when the gettin was good and then tighten the screws to get the market to work. Sheyah! It’s been mostly free riders until now. You are looking at the hard reality of decreasing gasoline carbon intensity.
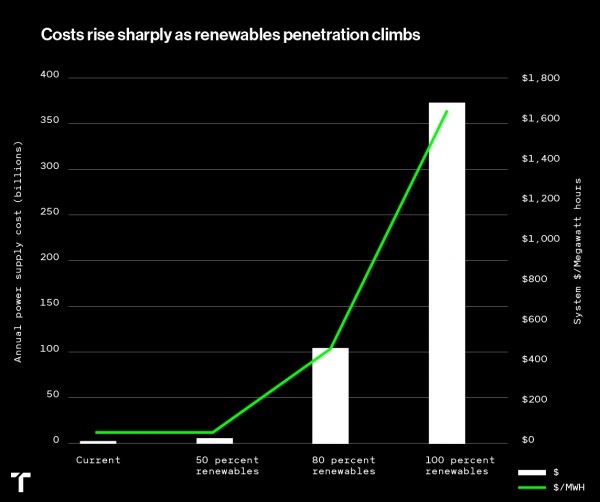
In the next couple years, prepare for politics to meet with physics. It reminds me of the lofty goals of greater than 50% renewable energy. At some point, the price begins to rise in a hyper-exponential fashion. See the chart below for an assessment of energy cost from 50% to 100% for California, published by a gentleman from MIT. That’s what policy in a physics vacuum looks like. Something like that will happen on California’s journey to a 20% reduction in life-cycle GHG from liquid fuels – at least for people who can’t afford $50,000 EVs.
Seasonal Fuels
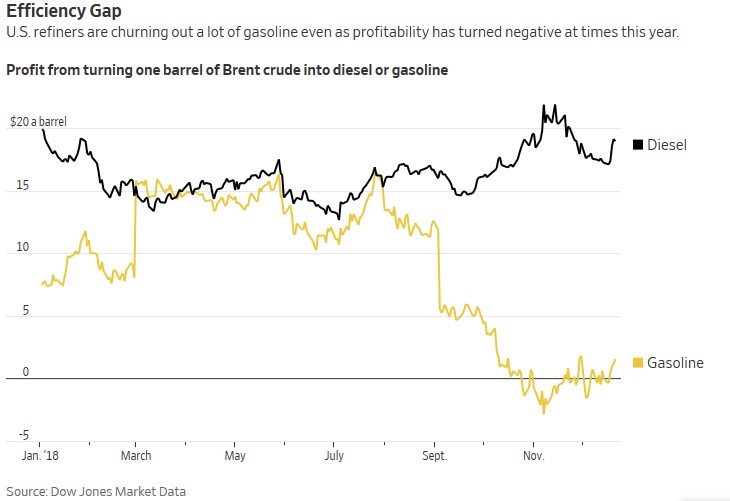
As I was researching the subject above, sprinkled over a few days, I found an interesting article, recently published in The Wall Street Journal – Gas Prices are Falling, but Refiners Keep Making More. In particular, the chart to the right caught my eye.
It appears something happened near the beginning and end of the summer blending season. I don’t know, but I like the thrill of the hunt.
I fondly remember the sweet smell of leaded gasoline as I waited in the car at the filling station as we traveled in the family sedan for our annual summer vacation. Nowadays, many places, especially those susceptible to ground-level ozone and smog, require summer blends. Like old new car smell, old fresh paint, old fresh carpet, glue and adhesives, the smell was one of volatile organic compounds (VOCs). Those were the days. We somehow survived.
You may have heard newscasts of AAA reporting that gasoline prices are set to rise around the Memorial Day holiday as refiners shift to summer blends of gasoline. Summer blends of gasoline are less volatile, as in less vapor, as in less VOCs and smell, all else equal.
The metric for pass/fail in this regard is the Reid vapor pressure (RVP), which is loosely correlated to the vapor pressure we learn in engineering classes. Classic vapor pressure is simply the pressure at which a fluid boils at a given temperature. For example, the vapor pressure of water at 212F is 14.7 pounds per square inch (psi), our nominal atmospheric pressure at sea level.
The EPA dictates that the RVP be less than nine psi and in some locations, the RVP is lowered to reduce VOCs in summertime. In some locales, it is as low as seven psi in the summer months.
Ironically, ethanol mixed with gasoline has a higher vapor pressure than pure gasoline. So, while trying to reduce GHG emissions, ethanol mixed with gasoline increases VOCs that cause ground-level ozone and other things.
Politics again met physics as the Trump administration waived rules on limiting VOCs due to ethanol-blended gasoline. Oh, the ironies.


Join the discussion One Comment