
Shortly after the Russia-Ukraine war kicked off, I quoted a panelist from the Wisconsin Public Utilities Institute. He said, “Watch what the Germans do and do the opposite.” My quote referred to the war, but the WPUI gentleman was discussing energy policy.
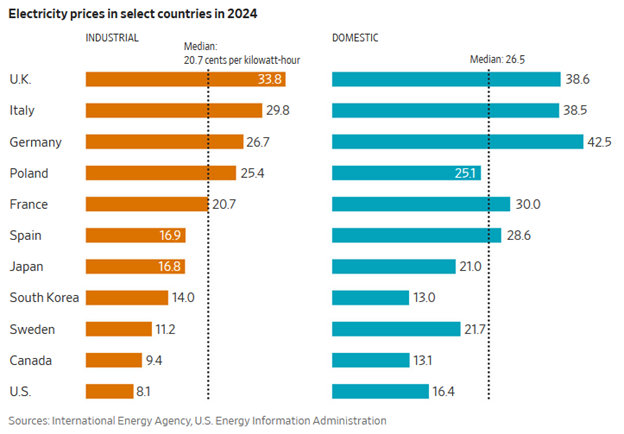
The Wall Street Journal recently reported Europe’s Green Energy Rush Slashed Emissions—and Crippled the Economy. The article includes Figure 1 below showing retail electricity prices in the developed industrial world. Whoa!
What’s even more surprising than Figure 1 is that China’s average electricity prices are substantially higher than those in the United States. The European Union’s prices are twice the prices in the United States and 50% higher than those in China. If I did my algebra correctly, the ChiComs’ electricity prices are 33% higher than those in the U.S.
Germany’s Lunacy
Three years ago, I lampooned Germany for shutting down its nuclear power industry in a knee-jerk reaction to Japan’s Fukushima plant that was wrecked in a 2011 tsunami. No one died. Despite having virtually no coastline and no risk of tsunamis, Germany decided not to take any chances. ? Result: Germany’s electricity prices are more than 3X the United States.
Figure 1 Competitive International Electricity Prices
The E.U.’s Obsessive Carbon Disorder Vs. Truth
Last summer, the European Union set a 90% reduction goal for carbon emissions by 2050, using 1990 as the base year. That was up from 55% by 2030. The Journal reports that E.U. countries outperformed (outslashed) carbon emissions compared to the United States. They say the E.U. slashed emissions by 30% compared to 2005, while the U.S. only cut emissions by 17%. But that’s not true per eGRID data, which I track, analyze, and tabulate like a demon.
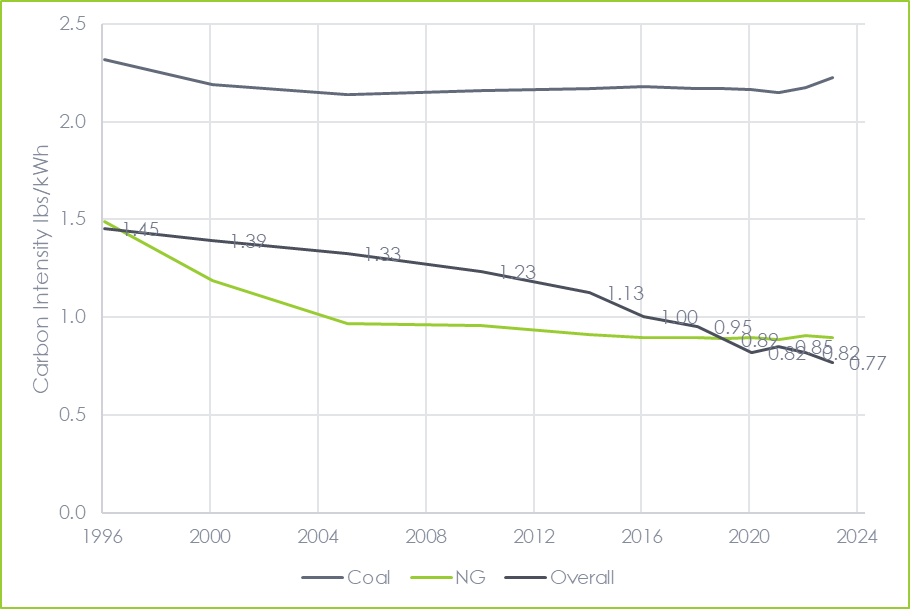
Figure 2 illustrates the overall reduction in carbon intensity from the electricity-generating sector in the U.S. Carbon emissions from the power sector have decreased by 47% since 1996 and by 42% since 2005. That is a remarkable achievement. Electricity production by natural gas increased by a factor of 2.4 from 2005 to 2023, and coal’s share declined to a ratio of 0.30 over that period.
Figure 2 United States Power Generation Carbon Intensity
Unlike the E.U., the U.S. did not shutter its bought-and-paid-for nuclear plants. The U.S. kept its dirt-cheap nuclear power plants online. They churn out 20% of the nation’s electricity with zero emissions. Nukes provide precious baseload power. I’m reminded of my analysis to cost-effectively decarbonize the grid in Case Studies in Decarbed Electricity. Check that out.
Misrepresented Emissions
The next misleading chart for the Journal is shown in Figure 3. Yes, the volume of fossil-generated electricity in the U.S. declined by only 16%. The eGRID numbers I mentioned above check out with the data in Figure 3. See Figure 4[1]. Close enough for instant replay. ?
Figure 3 Fossil Fuel Generation by Region/Country
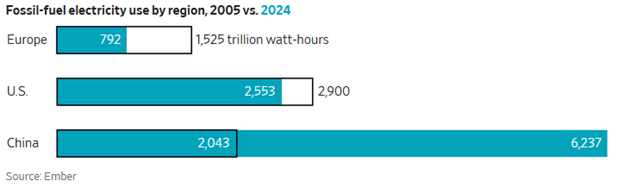
Figure 4 eGRID Fossil Generation United States

The misleading thing, of course, is that electricity produced by newer combined-cycle natural gas has roughly a quarter of the CO2 emissions compared to coal. First, the CO2 emissions per million BTU of natural gas are about half the emissions of coal. Second, combined cycle natural gas plants operate at about twice the efficiency[2][3] of coal plants. Half the carbon emissions per BTU of energy and half the BTUs of energy required to generate electricity with natural gas equals a 75% reduction.
In case you are wondering why the switch to natural gas for power generation – it’s greenbacks, baby.
The Cost of Redundancy
The enlightened masterminds in Brussels have discovered the necessity of redundant backup power to fill gaps left by renewables, especially solar.
Figure 5 shows the EU’s bet on renewables. Germany, not exactly the “Saudi Arabia” of sunshine, has gone crazy over solar, as has the UK. You know that Beatles song, “Here Comes the Sun, dah, dah, dah. Here comes the sun. I say, it’s all right.” There isn’t any in the UK.
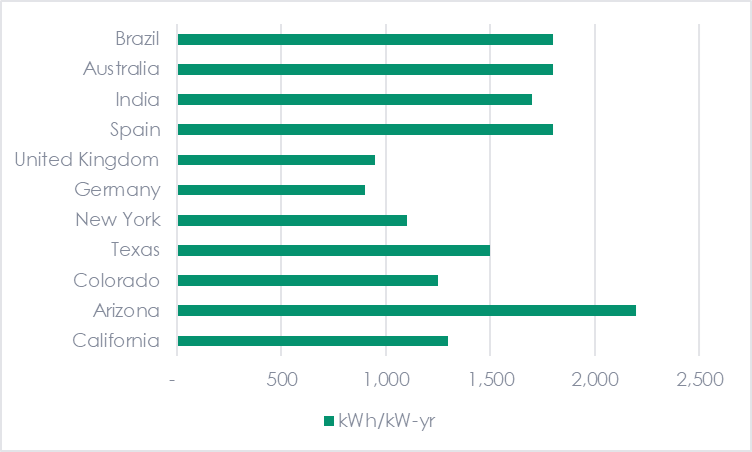
Getting serious, Germany and the UK have about the same solar potential as upstate New York, Pennsylvania, and Michigan. See Figure 5 and Figure 6. For more beauty in wind and solar potential in the Northeast U.S., see the 24-7 Carbon-Free Energy Hall of Mirrors from exactly two years ago. Solar has a terrible load factor in those unsunny places of the planet.
Figure 5 The E.U.’s Bet

Figure 6 Worldwide Sample of Solar Potential
To quote the Journal, “While sunlight and wind are free, harnessing them entails significant infrastructure investments, including in battery storage for when the sun isn’t shining or the wind blowing, and vast redundant capacity. These additional costs, obscured by subsidies and carbon taxes, mean energy prices in places like Germany and the UK are likely to remain higher than other countries for years to come.”
Where have I read that before? Try Table 1 for a sampling. Levelized cost of energy is free like water falling from the sky, but when you’re in the hot July DC Mall, it’s $4 per half liter, and how much from the tap at home?
Table 1 Sampling of Rant Posts on Redundancy Costs for Renewables
Reason | Date | Redundancy / Backup Requirement | Firming / Reliability Cost | “Cheap Renewables Mispriced” Argument | Thermal Generation Role | Link | Key Quote / Evidence Line |
Blistering Wind and Solar Energy | 17-May-22 | Yes — overgeneration + curtailment still require dispatchable reserve | Yes — renewable ramping imposes system cost | Yes — cheap energy ≠ cheap system | Strong — thermal necessary to stabilize | “When the wind drops, something must be there instantly to pick up the slack.” | |
Phony Avoided Cost Models in a Free-Agent Market | 11-Oct-22 | Yes — renewables cannot meet load without backup | Yes — avoided-cost ignores backup obligation | Yes — renewables look cheaper than they are | Strong — thermal carries reliability | “Avoided cost ignores the need for dispatchable capacity when the sun and wind check out.” | |
Electric Ratemaking Basics and Load Flex | 05-Sept-23 | Indirect but clear — removing thermal erodes reliability margins | Yes — system cost rises as dispatchables are pushed out | Yes — renewables distort market signals | Strong — thermal still needed for peaks/firming | “You can’t retire firm plants and expect reliability just because average energy is cheap.” | |
Planes, Bikes, Automobiles, and the Deceptive LCOE | 27-Jun-23 | Yes — intermittent supply needs backup | Yes — LCOE ignores system/firming costs | Yes — misleading comparison | Strong — dispatchables required | “LCOE ignores the cost of making intermittent resources behave like firm power.” | |
The TRC is Calling – Has Anyone Seen 1979? | 31-Oct-23 | Yes — firm capacity matters in real cost | Yes — “full cost” includes reserves | Yes — renewables appear cheap only via accounting tricks | Yes — thermal sets real system cost | “We need a full cost of energy – FCOE – that includes system and reliability costs.” | |
A More Cost-Effective Energy Transition | 4-Jun-24 | Yes — storage + backup overwhelm “cheap renewables” | Yes — firming cost described directly | Yes — system cost dominates energy cost | Yes — thermal used as baseline reference | “The full cost of electricity includes the resources needed to make it reliable.” | |
Electrified Heating – Thinking it Through | 15-Apr-25 | Moderately — electrification forces more capacity planning | Indirect — cost of service > cost of energy | Yes — low fuel ≠ low delivered cost | Implied — new CC gas plants | “Cheap energy does not mean low delivered cost when the system must be built for peaks.” | |
Defending Utilities and RTOs | 04-Jun-24 | Yes — redundancy burden on RTOs due to intermittent supply | Yes — cost shifts from energy to reliability | Yes — renewable price signals are false | Strong — thermal supports grid reliability | “Intermittent resources increase the burden on RTOs to maintain backup capacity.” | |
Electricity’s Decoupling from Fuel Costs | 27-Aug-24 | Yes — cheap fuels still need redundant capacity | Yes — system cost > fuel cost | Yes — “cheap” inputs don’t yield cheap electricity | Strong — dispatchables provide real reliability | “Fuel is cheap; electricity isn’t—because reliability and redundancy dominate costs.” |
The moral of the story is to use the assets and resources you have, especially the ones that are sunk costs. Prepare to pay for bad ideas. And, of course, observe what Germany does and do the opposite.
Figure 6 References
Rio de Janeiro data show annual yields 1,640–2,007 kWh/kW-yr; 1,800 is a mid-range value typical of Brazil’s high-insolation belt. (PVKnowhow)
Australia sits in the “excellent resource” category (>4.5 kWh/kW/day), i.e. ≥1,640 kWh/kW-yr, with many interior locations higher; 1,800 is a sensible round figure. (World Bank)
India’s solar atlas (PVOUT) and World Bank PV-potential work put much of the country in a high-potential band (≈4.5–5 kWh/kW/day), i.e. ~1,640–1,825 kWh/kW-yr; 1,700 is a reasonable central estimate. (ArcGIS)
Spain’s solar-resource reports and market analyses show PV potential of 1,700–1,934 kWh/kW-yr; 1,800 is a decent representative value. (PVKnowhow)
UK solar guidance and academic work put the national average around 950 kWh/kW-yr. (R&B Mechanical & Electrical)
German PV design texts and yield examples cite ≈900 kWh/kW-yr for south-facing rooftop systems in a typical location. (pdfcoffee.com)
Statewide Project Sunroof figure ~963 kWh/kW, and a utility tariff doc for the Lower Hudson Valley shows ~1,189 kWh/kW-yr; 1,100 splits the difference. (Project Sunroof)
Ground-mount systems in Texas are quoted at 1,400–1,600 kWh/kW-yr; 1,500 is the mid-range. (The Ground Mount Company)
Project Sunroof gives an average threshold of 1,250 kWh/kW for viable roofs statewide; Denver irradiance and sample system yields are in that ballpark. (Project Sunroof)
Utility / installer data and generic US comparisons put Arizona in roughly 2,000–2,500 kWh/kW-yr; 2,200 is a reasonable mid-point. (NenPower)
Google Project Sunroof’s statewide data show an average around 1,299 kWh/kW for viable rooftops. (Project Sunroof)
[1] eGRID plans to release 2024 data in January of 2026.
[2]https://www.woodwayenergy.com/natural-gas-efficiency-in-power-generation/
[3]https://michaelsenergy.com/question-carbon-benefits-answer-efficiency/