
People and firms talk about integrating evaluation findings into programs and portfolios closer to real time than the conventional methods. But what is really being done about it other than talk? This post features some concrete ideas to put in the bank – money.
First, what is the conventional evaluation process? Approaches and plans vary all over the place because different clients see different general approaches. For example, some clients evaluate every program every year. Some evaluate every program only once per EE plan cycle and within this subset, some evaluate them all in one shot over the course of a year or two, while others smear it out over the entire plan period. Still other clients seem to evaluate programs on a two year cycle, one at a time, each with separate RFPs.
In general, the issue is the program is designed/developed in a bubble, implemented and then evaluated.
Start with program year 1, or PY1 as we refer to it. While PY1 is underway, the evaluators are sipping margaritas in their hammocks, or maybe (positively) working on other projects. The evaluation report is due October 1 of the following year. At least for the impact (savings) evaluation, the program year ends before the impact evaluation starts. Why? Because the sampling Ouija Board shall not be referenced before the entire population of projects is in; the year is complete.
 From there, the battle for project data begins; days and weeks tick by, but the deadline is like the end of the subway line – it ain’t movin’. Meanwhile, implementers want feedback soon, but only if it’s the right feedback.
When it’s all done, two years of implementation are in the bank or destined for completion with no chance for improvement before evaluation results are in. Practically the entire plan cycle is over before implementers get feedback.
Sampling is the Problem
The headline answers the question, what is the problem? Sampling must be designed to hit the 90/10 industry standard, which is 90% confidence that the actual results of the entire population fall within plus or minus 10% of the sampled results. (I’ll save an explanation why this is naïve for another time) To achieve this, we do what we did 10 years ago without the sexy name: stratified sampling.
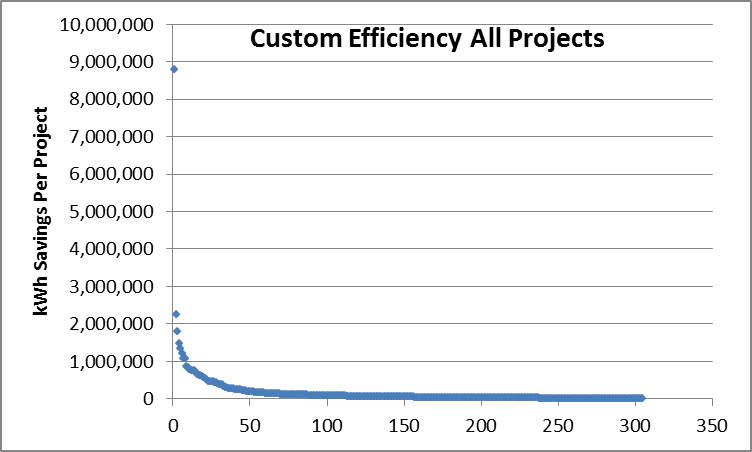
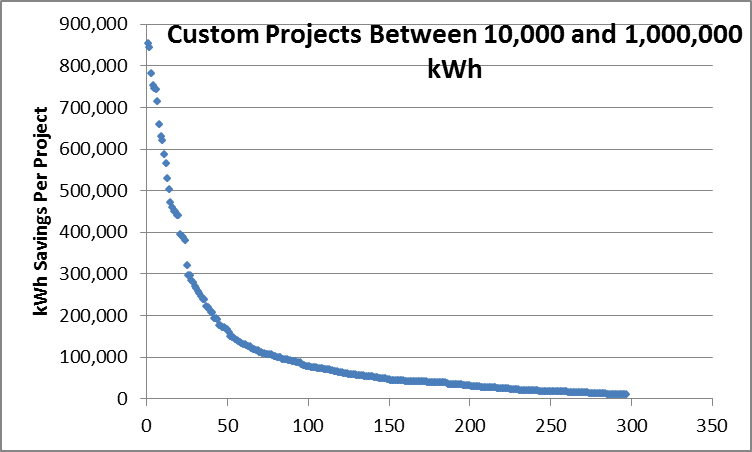
The mysterious Ouija Board is actually pretty simple. Take the population of projects and sort them from large to small. Below is a chart showing about 300 projects from one year for a custom efficiency program. These are represented in the scatter plot below. The chart following that takes out the high and low outliers to provide a better look at the population.
Then plot cumulative savings from the largest to the smallest project, shown in the next chart.
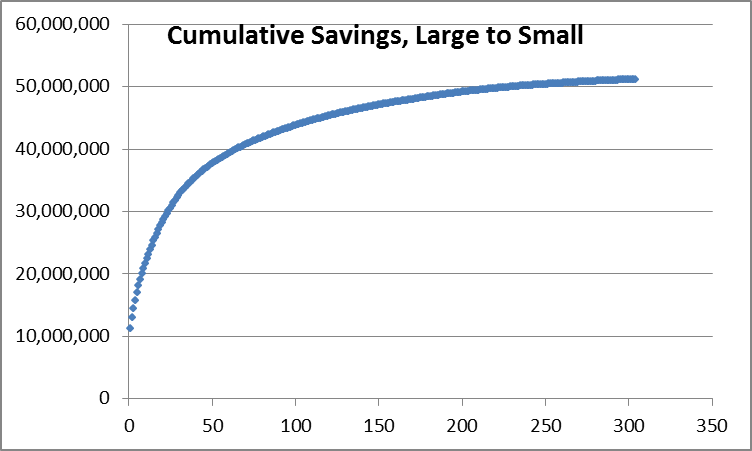
Isn’t that nice! Every time I see the results of a stratified random sample of projects like this, the count required to achieve the 90/10 confidence/precision factor is 80, plus or minus a handful. Call it 80 and I can all but guarantee that will hit 90/10.
Looking at the data, I see five strata, each representing 10 million kWh. The project counts in each strata are as follows: 1, 9, 17, 48, and 230. The largest project stands alone. You can almost count the next nine dots in the chart, and so on.
From here, take random samples in each strata: 80 divided by 5 = 16. The first two strata don’t even have 16 each, so we take all 27 for the first three strata. That leaves us with 53 for the last two strata, when we only need about 32. What the heck, just take 26 randomly from each and call it good. There, ladies and gentleman, is a stratified random sample of projects hitting 90/10. At my bill rate the cost is a whopping $300.
One could do a training course on this but it would put everyone but the statistics majors into a coma. The challenge arises when the client wants a bunch of segmenting by technologies, regions, and maybe other things. In most of those cases, you do the same thing after chopping the data into bins and 90/10 may not be achievable for all the desired subsets.
Getting Current
How do we move evaluation much closer to real time? Look at the data! Only the savings for the huge projects have a lot of variability and uncertainty. But so what? We are going to look at all of them anyway. In the previous example, 60% of the portfolio savings came from less than 10% of the population. Twenty percent of the savings came from the next 48 and twenty percent from the next 230 projects.
The evaluation could be completed just a few weeks after the program year, in January, rather than October. Take care of the random sample of smaller projects by August and leave a few slots (budget) for any large projects that come through. If the implementer wants real time evaluation, they can tell the evaluator what’s in the pipeline and what is going to come in by the end of the year. No one can tell me this can’t be done. The only things in the way might be silly technological or bureaucratic labyrinths, or lack of priority. If you want it, it’s there for the taking. Just make it a priority.


Join the discussion One Comment