
This is the third and final edition of the history of energy efficiency and Michaels Energy over the last 40 years. The first edition, covering the Early Years Through Deregulation, spanned 1984 into the Great Depression of Energy Efficiency. The second edition described the resurgence of energy efficiency and the birth of Portfolio Blowouts in the Great Lake States and beyond. This edition covers the efficiency program plateau of the last decade and projects for the future.
Lighting Technology Evolutions
During the boom and plateau years from 2000 through today, lighting retrofits cycled through every sector – residential, commercial, and industrial – for an average of 2.5 generations of improvement.
Improvements included:
- T12 lamps and magnetic ballasts replaced T8 lamps and electronic ballasts[1]
- Standard T8 lamps to premium T8 lamps
- Incandescent to metal halide or high-pressure sodium replacements
- Metal halide, mercury vapor, or high-pressure sodium to high bay fluorescents
- Incandescent to compact fluorescent
- Linear T8 to LED
- Compact fluorescent to LED
Jeff, you said 2.5 generations. That’s about three times as many.
Yes, but for any given use case, say a gymnasium, there may have been two or three upgrades over the years.
I remember high bay fixtures that featured six or eight compact fluorescent quad-tube lamps sticking out radially within the reflector. I could not find images of those clunkers online. Apparently, there is no money in posting photos of obsolete and not-yet-cool vintage equipment. But thanks to our stash of obsolete catalogs, I have scanned some clunkers for your pleasure. The pics below show variations of high bay fixtures designed for the applications shown and a screw-in quad tube.
Note that “pulse start” metal halide fixtures were also more efficient, and some ballasts could “restrike” more quickly. Why does that matter? The base technology would take 15 minutes to reach full brightness, so they were never turned off. Quick strikes came up to brightness much faster.
 The Lighting Cliff
LED marks the end of the lighting gravy train because of the 1/x paradox demonstrated by car mileage, in case you need an example. Once energy consumption reaches a certain low level, even a savings of 33% isn’t enough to pay for anything.
Lighting represented most of the portfolio energy savings for 25 years nationwide. I don’t have comprehensive data, but recent findings on four or five portfolios indicate lighting historically represented 60-80% of portfolio savings. Historical data from ComEd and Wisconsin’s Focus on Energy portfolios support my 60-80% claims[2].
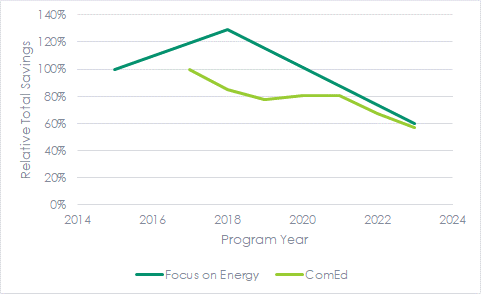
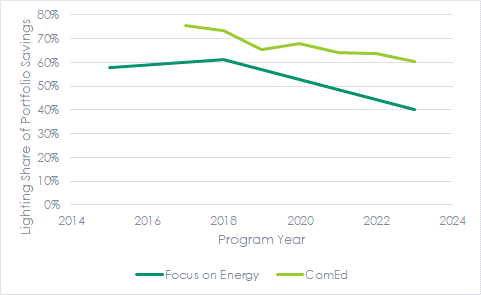 As the share of lighting has dropped, so have the total portfolio savings for each, as shown in the following chart. I used the earliest readily available data as the baseline. For Focus, that is 2015, and for ComEd, it is 2017. Total savings in both portfolios are down 40% relative to their baseline year, mainly due to the “lighting cliff.”
 Paradigm Revolution explains the trajectory of lighting, HVAC, and overall energy code advancements. The 1/x paradox makes achieving historic savings goals increasingly challenging.
Portfolio Needs and Policy
So where do portfolio administrators, including utilities, quasi-government non-profit organizations, and community choice aggregators, go from here? To wrap up this series, I suggest three elements:
- Deploying alternative technologies
- Deploying advanced programs
- Focusing on when rather than how much energy is saved
Alternative Technologies
Lighting is the most ubiquitous technology. It’s everywhere, in every building type—residential, commercial, institutional, industrial, and outdoor. However, there are also scalable technologies like voltage optimization, compressed air nozzles, and even the building envelope.
Voltage optimization is a grid enhancement that lowers voltage in the specified control band. Per the DOE, the delivered voltage can vary by up to plus or minus 5%—whoa! Voltage optimization reduces demand and wasted energy for specific loads, including motor-driven loads. Motor-driven loads include pumps, fans, refrigeration, compressed air, and processes.
I spoke with an evaluator of a voltage optimization program earlier this year, and he said one thing grid operators learned from the experiment was how much voltage varied on their grid. The end of the line has the lowest voltage. Voltage optimization is substantial enough to warrant a separate discussion and blog post.
Compressed air nozzles reduce turbulence by entraining ambient air, thereby extracting more useful work from the expensive utility known as compressed air.
Advanced Programs
Continuing with compressed air and the next bullet above (advanced programs), step one in reducing expensive compressed air and the energy required to produce it is to eliminate dumb uses such as cooling, drying, debris removal, or as a motive force. Good uses include education, like levitating golf balls. Adorbs.
Furthermore, program administrators must deploy long-term strategic energy planning for their customers because the 1/x paradox produces ever-tinier incremental savings. Get this: codes and standards dictate minimum widget efficiency, but they do not dictate systemic design modifications that can save huge amounts of energy in buildings and manufacturing processes. That is a workaround to claim savings and avoid the code compliance zombies.
If you remember anything from this post, consider any planned system upgrade that takes savings on incremental widget efficiency as a program failure. Failure! Programs must do more by addressing the entire system for efficiency.
Load Management v Energy Savings
I recently attended the Midwest Energy Efficiency Alliance’s (MEEA) annual meeting of the membership, during which we had a small working group to discuss integrated demand-side management. Not realizing it at the time, I had already written about IDSM a year ago, explaining how to reorganize portfolios to capture load as well as energy savings.
One of the points (questions) I made at MEEA is: why are efficiency portfolios incentivizing, which is to say, paying for energy savings when load management is becoming more critical in these times of deep renewable energy penetration? Total fuel (energy) costs continue to decrease because wind and sunshine are free, but the full cost of electricity supplied is soaring. That is because of the intermittency and high cost of dual generating capacity necessary to power the grid when it’s dark and calm outside. Load management and demand reduction can displace some dual generation, transmission, and distribution.
At the MEEA working group, I asked if any portfolios have driving kW goals, meaning kW rather than kWh goals. No. They have kWh goals, and the kW comes along for the ride. This needs to be reversed. Energy is cheap. Capacity and the cost to deliver it are not, and that is where the emphasis must shift.
[1]Ballasts regulate voltage to strike a lamp and manage current to keep it lit.
[2]I only selected three sample years for Focus – the first and most recent datasets and one in the middle.