
NERC sounds alarm on solar tripping in sobering summer reliability report, May 19, 2022, UtilityDive.com. This seems like a timely sequel to last week’s Blistering Wind and Solar Energy post, in which I summarized the results of a renewables integration study performed by the Midcontinent Independent System Operator. The blisters represent pockets of excessive renewable energy generation and the “very different reliability risks than are experienced today,” as described in the MISO report.
Electronics provide voltage and frequency control from solar panel generation. When the solar tiger grows from a cub that we had a few years ago into the ravenous adolescent tiger it is today in some places (California), it’s a different animal. And it’s coming to other states and utilities.
Inverters convert direct current power from the solar panels to alternating current, synchronized to grid frequency. I spent an hour searching and studying how wind turbines synchronize to the grid, and I was surprised to find that a small multitude of options are used to synchronize with the grid (I wouldn’t mind having that hour back). Bottom line: inverters are flaky, subject to tripping hundreds of megawatts of solar panels offline for something like a lightning strike.
In the big picture, reliability is a problem in competitive wholesale markets because, as I’ve written many times, no one entity is responsible for reliability. Generators get paid for energy and, in most regions, capacity. Do they get reliability payments? Not yet, that I am aware of. State governments deploy a hodgepodge of renewable energy portfolio standards. State and federal regulators, legislators, and executives continuously manipulate, push, pull, hammer, lavish, expand, and contract various energy resources. The regional transmission organizations, like MISO, are tagged to do their best with a bad-news-bears fleet of generators and fuel supply across a bunch of states. Result: an abundance of “not my fault” and unchained chaos coming right up.
So, what can we do? That is the question for the next couple of posts.
Standby Power
First, fantastic times are ahead for standby generator sales. Policymakers MUST factor in costs for these expensive machines when determining whether demand-side resources are “cost-effective.” Consider that options include supplying enough dispatchable (reliable) generation to keep the lights on or curtail with demand response, efficiency resources, and customer-funded backup resources (aka, self-generation). California, for one, has offered a Self-Generation Incentive Program for several years. That’s an option; another is to avoid its need. Both cost money, but one, avoidance, costs less.
Demand Side Resources
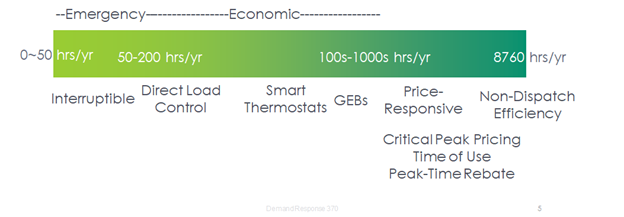
A wide variety of demand-side resources are available to manage the future rickety, fingers-crossed electricity supply. Let’s look at a cartoon I remade using a graphic from PLMA. Figure 1 provides a spectrum of demand-side resources.
Figure 1 Demand Response Spectrum
 Efficiency
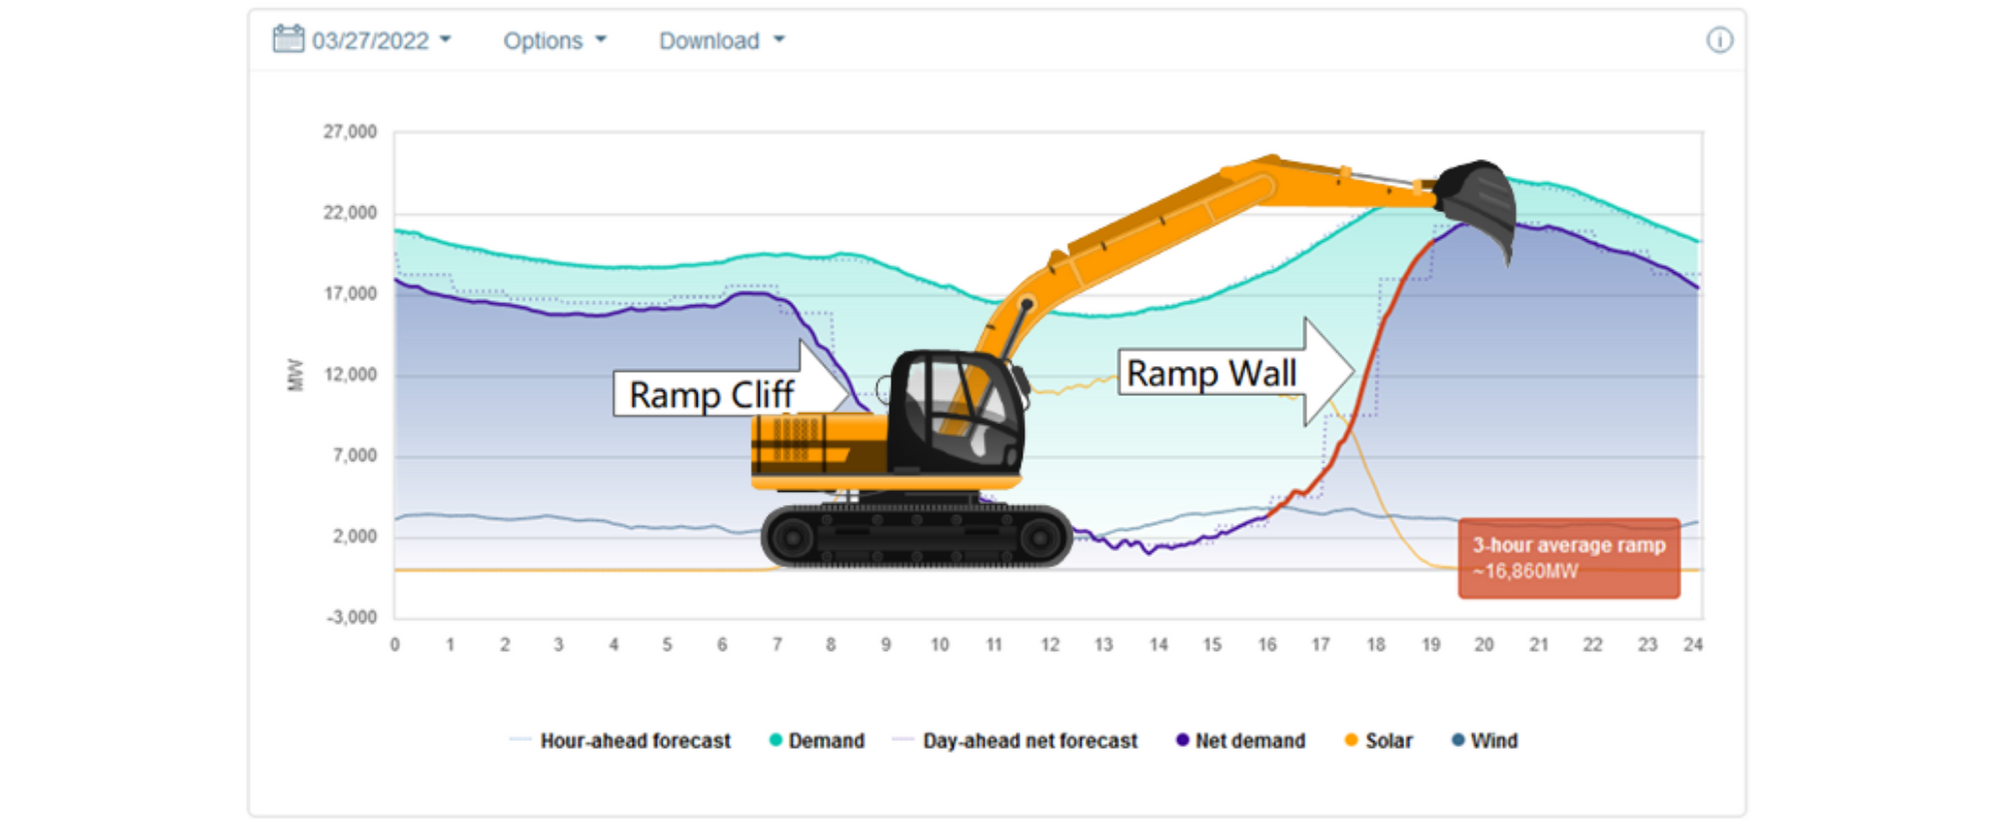
Readers are likely aware of the duck curve, represented in the net load chart below, which was also provided in last week’s post. Net load is the load conventional generators must satisfy at all times. Does that look like a duck to you? It seems more like a snowboard or skateboard half-pipe – the skateboard curve.
Traditional efficiency, mainly consisting of lighting and air conditioning, subtracts from the net load in the middle of the day, when solar is raging, and then to some extent, goes away during the ramp wall.
The first thing should be deploying efficiency resources to plow into that ramp wall. Retro-commissioning is a big one because you can see the ramp wall hits from 17:00 to 19:00. Shut things down in commercial and many institutional facilities, including k-12, colleges and universities, and non-retail.
Another is smart electrification. Policymakers need to understand the load shape of electrification technologies before blessing them with incentives. Decarbonization is worth less than zero if the electrification technologies take down the grid, which could happen at the most vulnerable and dangerous times.
Thermal Storage
I’ve never seen, heard, or read it before, so I’ll say it: Thermal storage is the best duck curve breaker that no one talks about. Consider all the heating and cooling loads that are met with electricity or natural gas: water heating, space heating and cooling, process heating and cooling, and refrigeration (cooling and freezing).
Thermal energy storage for heating and cooling is accomplished compactly using phase change materials (PCMs), including water, salt water, and organic compounds known as hydrocarbon chains. The organic compounds include fats, like coconut oil, that melt and freeze right around room temperature. If you have a jar, it might be solid in winter and liquid in summer if you maintain your space temperatures at energy-saving setpoints.
Many PCMs provide excellent temperature stability, improve operating efficiency, and provide backup cooling for a few hours in case of equipment outages or a flaky grid.
Phase change materials can also be used to add thermal mass to buildings to, for example, store solar gain in summer by adding it to wall construction. A PCM may be deployed with a west-facing wall to absorb the hot afternoon sun (melt) while for the next 18 hours, it releases that heat back to the outdoors. The solar gain never gets into the building. Cool?
There are dozens, hundreds, thousands of applications for PCMs, but they are not the sexy, hyper-expensive, despot-controlled, fire-prone lithium-ion battery, so it will take some time for them to emerge – not if I can help it[1]. And PCMs require no maintenance and last forever in Li-ion years.
Next Up
Decarbonization by way of renewable energy and electrification is exceedingly complicated – like one trillion (100% renewable) versus one billion (the grid of 2004). To comprehend the complexity, I recently read a short ditty:
- A million seconds was 11 days ago.
- A billion seconds takes us back to 1990.
- A trillion seconds: 30,000 BC
Yep, that’s about right.
[1] Doug Houseman, a battery expert I interviewed, posted on LinkedIn that he thinks battery fires are underreported. https://www.linkedin.com/feed/update/urn:li:activity:6930096697150738432?commentUrn=urn%3Ali%3Acomment%3A%28activity%3A6930096697150738432%2C6930114854942904320%29
