
This week’s rant is brought to you by Ryan Kroll, Michaels’ Program Evaluation Manager. Last week Ryan issued a Program Brief discussing 90/10 confidence and precision sampling that is the industry norm for energy efficiency program impact evaluation. The 90/10 simply means the results of the sampled projects have a 90% probability of being within plus or minus 10% of properly representing the entire population – and NOT necessarily the right answer. Sample representation and the right answer are obviously different things.
Here is the perversion in impact evaluation that I’ve never seen written anywhere: The less you learn about and investigate actual projects in the sample for impact evaluation, the greater the perceived confidence, precision, and even accuracy.
How can this be? How can knowing less be more confidently precise? The key word is “perceived”. As Ryan wrote, “Ignorance is bliss”.
Let’s start with the philosophy we use for verifying energy savings. That philosophy is, “Guilty until proven innocent” and “Innocent until proven guilty”.
Take “Guilty until proven innocent.” We begin savings verification with the mindset of, prove it. Convince me this project is actually saving energy as claimed; is not a total free rider; that the savings calculations are correct; the baseline assumptions are correct; and the project was actually implemented per the evidence presented.
“Innocent until proven guilty” we use for making adjustments to savings. Savings are not adjusted until there is concrete and reasonably repeatable evidence that an adjustment must be made. For example, if an efficiency of 0.42 kW/ton was used for the calculation of savings for a new chiller in a custom calculation, and manufacturer data clearly indicate that the actual efficiency is 0.50 kW/ton, an adjustment is warranted. Another example would be hours of use may be measured to be 25% lower than the data used in the energy analysis for a given project. This is beyond what is considered to be normal variation, just don’t ask me what that threshold is.
Evaluation dollars are of course always scarce, and therefore, many times there is a balance between getting 90/10 for the sake of 90/10 and being able to prove you have 90/10 – versus finding out what is really going on with a smaller sample. In other words, the choices are rosy scenarios that resemble empty boxes in Christmas attire in the department store, or an autopsy. One is a fluffy illusion and the other is an unsavory mess, but at least something is learned.
Everyone has their opinion on what is important in a program evaluation. I’m going to make my pitch for actually learning something at the expense of statisticians or number nerds whose main objective is 90/10.
It’s simple. If I have no information beyond a half-baked document from the program tracking system with no budget for going on site to at least verify counts and interview occupants, I can find nothing concrete on which to base an adjustment, but also nothing concrete to demonstrate what I can’t tell was supposed to happen actually happened. I also haven’t learned anything on behalf of the ratepayers who subsidized with big coin the installation of the participant’s project. So, just keep going on our merry way to a confidently precise mirage. I would rather have a confidently realistic investigation of fewer projects from which I can develop patterns and recommend corrective actions to improve the real accuracy and benefits of the program. To me, this is better than a decorated empty box.
Moreover, if I don’t investigate the project as installed, interview the customer, take measurements, log data, and simply look at incomplete documentation, I have no justification to make savings adjustments. The less I have access to, the less variation there is in my investigation. The lower the variation, the smaller the sample size required. I don’t know anything about statistics, but if I have a coin it doesn’t take many flips to determine the odds of flipping heads is 50/50. On the other hand, if I have a 500 surface die (singular for dice) such as numbering all the dimples on a golf ball, I need a hell of a lot more rolls to determine the distribution. The coin flipping represents documentation desk review – lala land M&V. The golf ball represents doing field inspection where the number of variables to review explodes, and their variation is also much greater – reality.
In sum, if I do no digging, my sample size is much smaller for 90/10. If I do no digging, the digging cost is much less. Therefore, one can achieve 90/10 very cheaply – but remember that is 90/10 probability/precision that the lousy verification method used on the sample would apply to a lousy verification of the entire population.
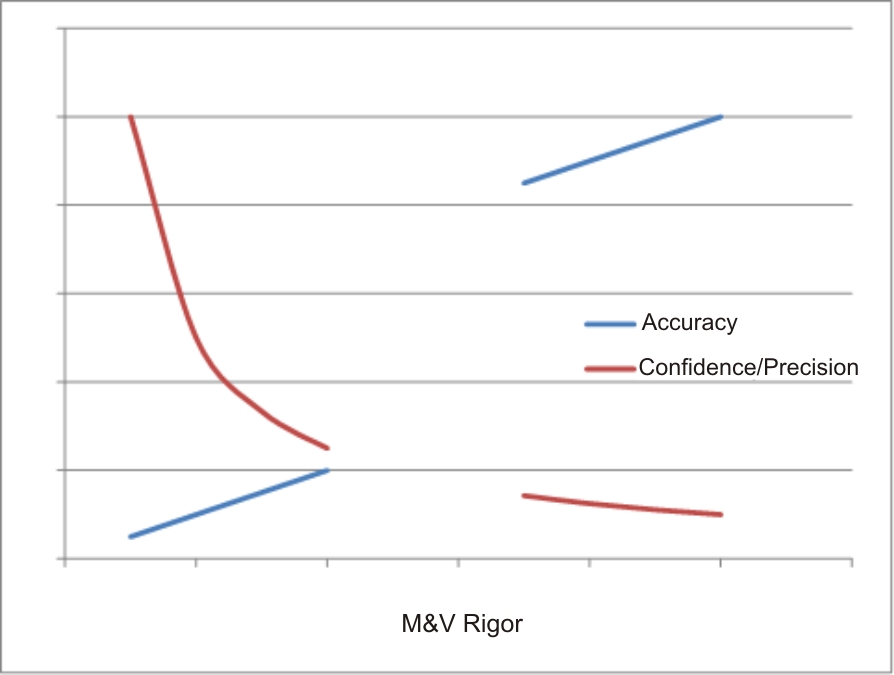
The chart demonstrates how for a given smallish sample size, the accuracy of the sampled projects and the confidence/precision varies with the level of M&V rigor. The discontinuity in the curves represents the jump from not leaving the cubicle to going to the customer site for inspection, interview, measurement, observation, logging, etc.
Beware the shiny boxes with nothing in them.
