In this week’s Energy Rant, we’re covering part two of good, perfect, and real carbon targets.
Last week we looked at grid-scale energy storage options for a couple of them, namely hydrogen and flywheels; I asked, “What could go wrong?” To be fair, my comment on hydrogen was its use as a buoyant gas to float the Hindenburg. Hydrogen, while very light, is explosively combustible, so putting it in a blimp was crazy.
I always like to throw factoids in for budding STEM enthusiasts. Take a helium (non-combustible) balloon on a string, hold it by the string in a moving vehicle. Have mom take a hard left as I do. Everything in the trunk slides to the right. What about the balloon? It moves left. Dazzle your kids with that! Even cold air coming out of the dashboard bends when you take a hard corner, but that goes the other way because it’s heavier than ambient cabin air.
The flywheel has enormous kinetic energy, spinning at thousands of RPM and weighing thousands of pounds. If it should come undone in that condition, look out! In one case, the friction got so hot that when water was injected to cool it down (never, ever do that – it’s how boilers and many things explode), and it exploded in a blast of steam. That is some serious design and engineering ignorance. So, what do you do when you see a car tire or wheel rolling down the street – GET OUT OF THE WAY! It has rotational and straight-line energy.
Let’s look at some of the factors of various technologies discussed last week regarding important characteristics of storage options: mobility, land requirements and siting, storage duration, useful life, and round trip losses. The dimensions involved with this analysis are staggering, but that’s why I like it.
Construction and Operating Cost
Energy storage is just that – it generates no energy. In the case of electricity, it must be paired with a generating asset.
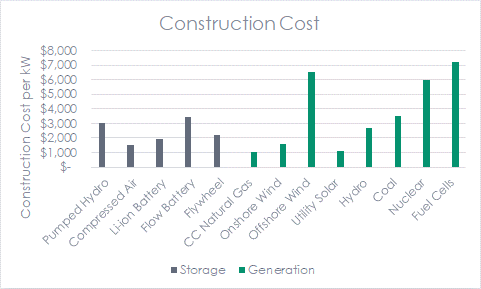
Data in the charts[1] and tables of this post are from these sources: here, here, here, and here. The first chart shows the construction cost per unit of capacity in kW.

Renewable energy plus storage compounds costs. At a minimum, a generating asset plus storage is required. For some technologies, we have generation, conversion/storage, generation. That would be hydrogen storage. Hydrogen is produced through electrolysis powered by a wind turbine. The hydrogen is compressed and stored, and then it can be used in a fuel cell or combined cycle power plant to convert back into electricity. I didn’t do the math, but this is kind of like cutting down a tree, milling the wood, producing a fine piece of furniture, and then burning the furniture to heat your home.
Levelized Cost
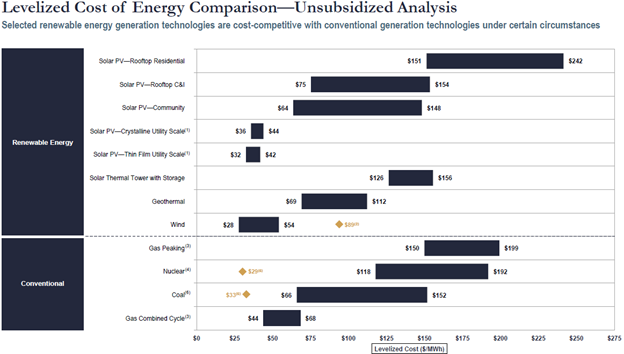
The first cost is only part of the cost to deliver power and energy. Every resource has a different operating cost to include fuel and maintenance. For this comparison, we refer back to last week’s Lazard cost of energy per kWh over the resource’s life.

But Jeff, a Li-ion battery will hold a charge for a lot longer than 46 minutes. This isn’t much of a factor for grid-scale storage because you can discharge ten batteries in series, each for 0.76 hours, one after the other, to get 7.6 hours of their capacity. You can also discharge them all in parallel and get the same 7.6 hours of their kWh capacity.
I calculated these hours to discharge simply by dividing the kWh capacity by the rated kW, and lo and behold, the hours to discharge (available power) are consistent with published discharge times.
Estimated useful life (EUL) is provided directly from the sources noted above or by the estimated number of cycles divided by one full round trip cycle per day. That may not be completely accurate, but it’s a good bookend. Flywheels can spin up and down many times a day and can act as a voltage and frequency modulator like a spinning turbine – a bonus.
None of the technologies are meant to carry a 24 hour period. As we saw in my first Li-ion post a month ago, battery technology is not yet cost-effective from an arbitrage perspective – charging when electricity is cheap and discharging when it’s expensive.
Report Card
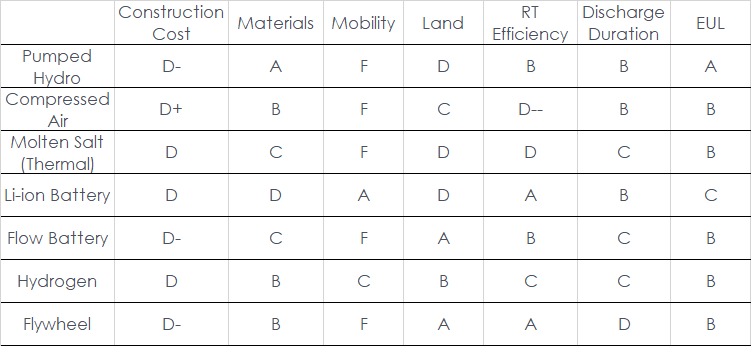
I eyeballed all the data and developed the following report card for various storage technologies with explanations to follow.

Construction Cost
Since all the technologies are technically possible, they have prices, and there are no Fs. If their cost of construction was comparable to coal, they got a D-.
Materials
This category grades how readily available materials are for construction. If the materials and labor are mostly home-based in the United States, like pumped hydro (concrete, land, steel), it’s graded high. If materials come from all over the planet, especially in massive amounts, from countries that are not where we’d want to live, no.
Mobility
It can move or not.
Land
What is the footprint, or how much earthen materials are required?
RT (Round Trip) Efficiency
This one is straightforward, but I would comment that I gave hydrogen (burning furniture) a C because it can be used as a transportation fuel. Maybe it deserves a B for that?
Duration
Duration is how long the resource can provide power. I gave Li-ion batteries a higher grade here for their use in automobiles.
Useful Life (EUL)
Technologies with lifespans on par with that of a power plant got Bs. The Li-ion battery is much shorter, but I graded on a curve because it is a good fit for EVs.
What about Carbon?
You may be thinking, “I thought this post was about carbon.” Yeah, yeah, I’m getting there. This is a big topic that warrants suspense and intrigue.
[1] Except for the Lazard chart.
