
Of fourteen categories of Rant topics, Climate Change scored a solid seventh place for subjects readers want to read about. I am certain you will find information in this post that you’ve never seen before.
As “settled science”, it sure is difficult to find unbiased information on this subject. In science we have laws, which are held to be true because nobody can prove otherwise. These include the law of gravity. Gravity on a planet or star is proportional to its mass. Others include the first law of thermodynamics (energy can change forms but never increases or decreases), second law of thermodynamics (water flows downhill unless there is a powered pump), and something called the zeroth law of thermodynamics (which is something useless like if two masses are the same temperature, they are the same temperature).
How do greenhouse gases work, and what makes a greenhouse gas a greenhouse gas? This was difficult to find, but it is a critical question.
What I found was that the criteria of a greenhouse gas is simple: it includes any molecule that has three or more atoms. If you care for punishment, you can read for yourself in this very good description from the American Chemistry Society.
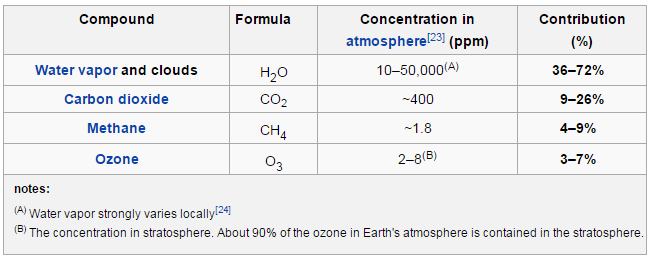
This is a BIG deal. Why? Because over 99% of the atmosphere consists of molecular nitrogen (78% N2), oxygen (21% O2) and argon (1%). Gee, these add to 100% – by rounding error only. They really add to just under 100%. The rest is mainly greenhouse gases. Water is the dominant greenhouse gas followed by, you guessed it, carbon dioxide.
Feedback
The effect on temperature caused by increasing carbon dioxide depends greatly on feedback; i.e., if I change variable A by 20%, what does this do to variables B, C, D, and E, and how does that all impact surface temperature? Truly, nobody knows. The only thing that is certain is more CO2 results in higher surface temperature, all else equal.
Water Vapor
Here in the north Midwest, water vapor concentrations vary from about 1000 parts per million (ppm) in winter to as high as 20,000 ppm (50,000 ppm shown above is completely off the chart, literally) in the summer.
I defer once again to an objective source, the American Chemistry Association, which states water vapor likely accounts for roughly 60% warming effect. As the article describes, the greenhouse effect due to water vapor is a function of the temperature, rather than the other way around. I.e., when it is 20F outside, water provides very little greenhouse kick. When it is 95F in the upper Midwest, you can bet water vapor is a major greenhouse gas. In moist regions east of the Rockies, water vapor holds daily summer temperature fluctuations to about 20F. In high desert regions, the daily swing is closer to 60F. Therefore, water vapor can keep the average temperature at least 20 degrees warmer in humid versus dry climates.
Carbon Dioxide
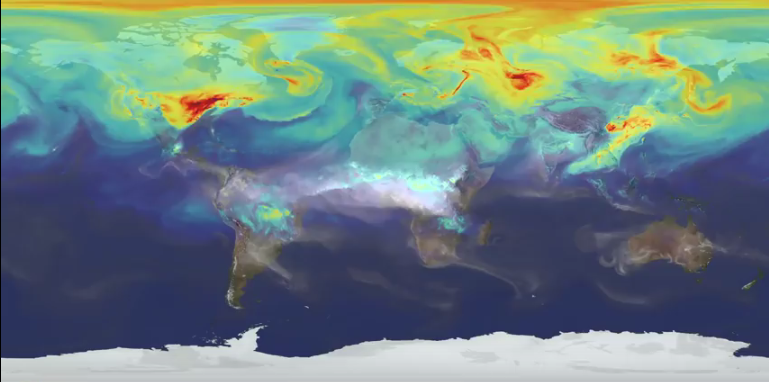
You may have seen this time-lapse video from NASA. The first screen scrape shown to the left is January 1, 2006. The video shows how CO2 concentrations change throughout the year. By late summer, the video seems to indicate that CO2 disappears. Why? Because plant life is gobbling up CO2 via photosynthesis. Then as winter builds, the leaves fall to the ground, the grass is covered with snow, and the lake algae blooms are frozen over, CO2 builds up once again.
Therefore, like water vapor but for different reasons, there is an auto-correction mechanism built in to CO2 concentrations. Increased CO2 adds plant food and temperature, both of which increase plant growth, which takes CO2 out of the atmosphere.
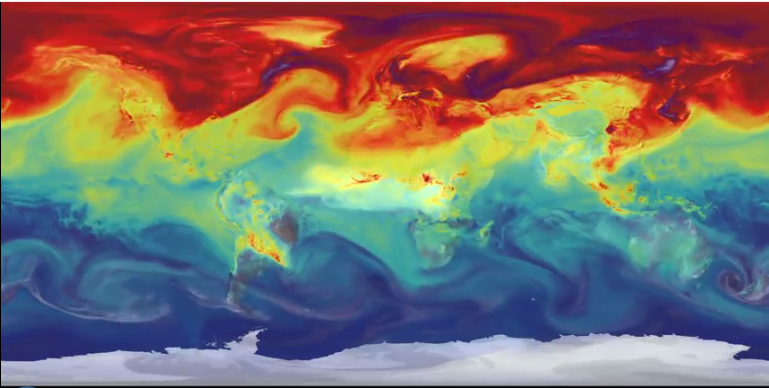
The first screen scrape to the left is for New Year’s 2006. The second screen scrape is Christmas 2006. It looks really bad doesn’t it? Everything north of the Mason Dixon line is on fire. What the heck is going on here? What is the scale for these colors? See below.
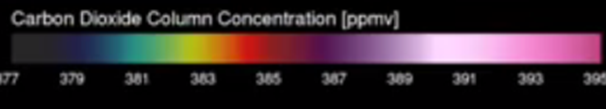
It is quite fuzzy but from blue sea to hellfire hot is 1, 2, 3, 4 ppm. Four parts per million difference is all! Ok.
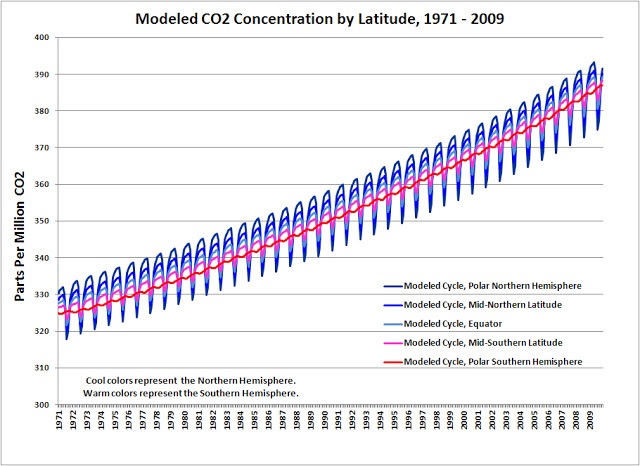
The next plot shows annual CO2 readings at various latitudes. Carbon dioxide levels vary more on a seasonal basis in northern climates, where the absorption shuts down in winter. On a global level, it all rises along the same average rate. Carbon belched into the atmosphere in China is no less dangerous than carbon spewed in the U.S.
It currently takes six years to move 10 ppm – just under 2 ppm per year. That is the difference in the NASA video above from New Year’s through Christmas 2006. [1]
So What?
The CO2 curves above are pretty, but what is the impact on temperature? Carbon dioxide disperses nicely to deliver predictable curves. As for weather patterns, not so much. Weather in North America depends a lot on equatorial Pacific Ocean water temperatures. Oceans are churning constantly and so our weather is erratic.
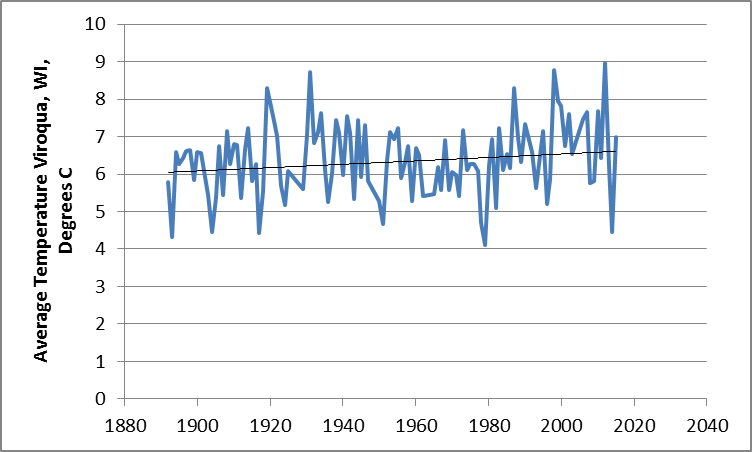
I leave off with this splendid data tool from NASA. It provides mean temperatures for thousands of weather stations around the globe. Shown to the left is the chart for a rural station nearest me. In the past 122 years, the average temperature has increased 0.6 degree C.
Draw your own conclusions. Find your own city. My only advice for that is pick a rural station to avoid heat island effects.
[1] Courtesy, http://dougrobbins.blogspot.com/2012/04/modeling-global-co2-cycles.html via Carbon Dioxide Information Analysis Center
