No one will confuse me with Simon Sinek, a great speaker, but one thing I can do is nail my timeslot. If I’m mindful of the time I have available, 20 minutes, etc., I will nail it – except one time[1]. That was last fall as I was doing my fourth rendition of electrification for the Wisconsin Public Utilities Institute. I update my presentation every year for current data and trends because the audience deserves it. But I tried too much stuffing for that bird. After several practice runs, I was consistently 10 minutes over the time limit. I thought I could cram it in on gameday if I stayed focused.
Lo and behold, I ran out of time, got the hook, and didn’t finish. What a dope! Why did I think I would defy gravity that day? There is a lesson here for resource adequacy, which I am writing about today; winging it and hope are not a plan.
Blowback
Last week I ended with the advice that this “energy transition” we are in will take time. We’re not going to electrify everything and be 100% renewable by 2030 or 2040 or (?). If we move too fast and aggressively, it will blow up and set it back a decade or two or more.
Interestingly, just a couple of hours after wrapping up last week’s post, I saw this article from Utility Dive, which we featured in The Hopper, our newsletter. One salient bit of that article regarding the push to be 100% renewable by 2050 is quoted here:
“If you look at the reality of what that would entail on the ground, the impact [of excessively ambitious carbon targets] would be such that I would anticipate any policy that pushes that change along would swiftly face blowback and ultimately be abandoned,” said Ryan Jones, co-founder of Evolved Energy Research. “That is the worst outcome in terms of this transition.”
That’s what I am saying.
I had printed this Resource Adequacy Challenges article from EPRI a few months ago. Now is a good time to roll it out to the audience. It does a splendid job explaining resource adequacy, ensuring there is enough power generation, transmission, and delivery to keep the lights on everywhere. They also investigated the events that led to the “rolling power outages” (blackouts) in California last August 2020.
Consequences of Electricity Floods
As I’ve written before, high percentages of renewable energy flooding the grid drive down prices such that baseload and dispatchable thermal generation (coal, nuclear, and natural gas) lose money, and they are forced to shut down. Nuclear plant owners are especially lobbying for subsidies to stay in business. Exelon is again clawing to keep its Illinois nuclear plants spinning. They say keeping the plants open will keep rates low, while in other states, utilities close the plants to keep rates low. Which is correct? It’s 95% a function of policy, law, and how the market works. Assets may be created equal, but their value depends on how the market operates. Give me a call. The first half-hour is free.
California’s renewable electricity supply milestones are 33% by 2020, 60% by 2030, and 100% by 2045.
Short Supply Meets High Demand
I don’t live and breathe CAISO, the California Independent System Operator, the load balancing authority for the state, but I seriously think to myself, I can’t believe they keep the lights on as much as they do. The state has been shutting down natural gas plants and huge nuclear plants for years. Three nuclear facilities are in various dismantling stages, and the last one, Diablo Canyon, a 2000 MW plant, is on the block for 2024.
Per the EPRI paper, the August outages resulted from a widespread western heatwave, covering most of the western interconnection, derated or unresponsive natural gas generation, and low hydro output. EPRI states the CAISO peak load was about 47,000 MW on August 14, the first day of the blackout. The day ahead forecast was accurate to 98.9%, but you can see, that is an “error” of about 500 MW or one natural gas unit. EPRI writes that an ~500 MW natural gas generator became unavailable a couple of hours before the event. Uh oh. Around 4:30 PM, CAISO had to drop 500 MW load, and again, at 4:45 PM, it had to drop another 500 MW, cutting 1,000 MW to a bunch of customers.
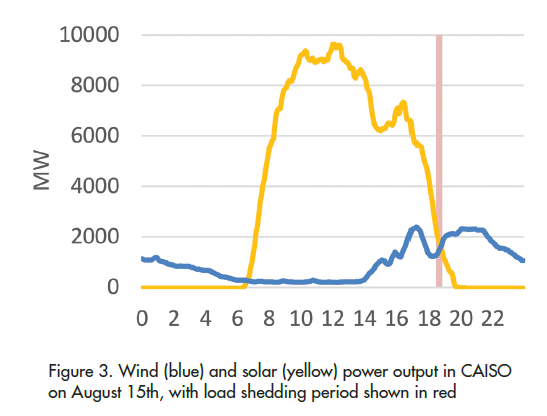
On the second day of blackouts, August 15, peak demand reached about 45,000 MW, less than the 14th, but CAISO still had to cut off about 500 MW to maintain resource adequacy limits. This time 250 MW of natural gas generation ramped down by operator error, I’ll call it, and the wind stopped blowing at an inopportune time, as shown in the chart below. The pink bar represents the interruption period.
 Perspective
 Perspective
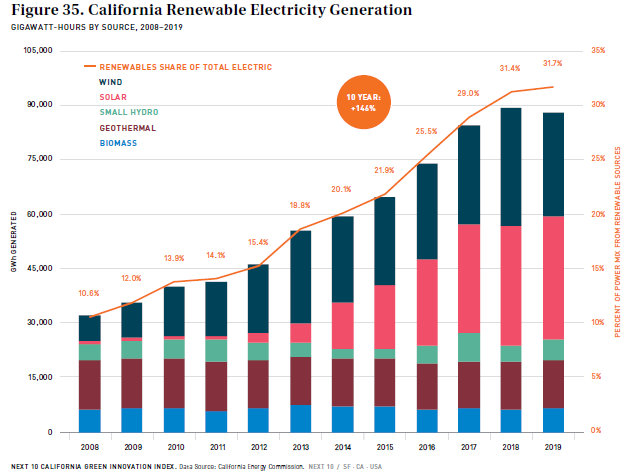
To give California’s August 2020 peaks of about 47,000, and 45,000 MW perspective, the highest peak occurred in 2017 with 49,900 MW. Also, renewable electricity production dropped in 2019, the most recent available.
 What we learned from this EPRI paper:
- Razor-thin margins (1% error) can result in a blackout.
- The net ramp when the sun sets decreases demand for fingernail clippers and emery boards.
- Two thousand megawatts can come in handy when you need it.
- Enough solar already.
- Where’s the wind?
- 100%?
[1] You might be thinking, you’ve blown it before during ___. Ah, ah, ah, I wasn’t mindful in that case.
