
It is challenging to avoid artificial intelligence and its implications for the electric grid and limit AI-centric blog posts to one per month. This post follows up and doubles down on AI, Manufacturing, and the Bridge Out Ahead, which discussed Trump’s tariffs, manufacturing, AI, and the associated soaring electric loads.
Trump’s Negotiating Tactics
Fortunately, I attended a two-hour session with world-class negotiating expert Deepak Malhotra from Harvard Business School. The topic everyone enjoyed the most was his assessment of Trump’s “art of the deal“ negotiating tactics. It’s safe to say Malhotra is no fan of Trump, in his own words.
I think of Trump’s tactics this way – predator hunting. Predators look for chaos; if there is no chaos, they create it. For example, big predator fish, like muskies, will hang out around the turbulence of an obstruction in a stream, maybe where a tributary enters a main channel or behind a boulder in the current. Land predators hunt in chaotic storms or trigger stampedes to pick off the weaklings and oldies. Mutual of Omaha’s Wild Kingdom, anyone? (that was my source of National Geographic on three-network TV over the airwaves back in the day).
Similarly, Malhotra notes that Trump likes to throw virtual policy grenades and plant extreme anchors to start the process. Examples? Buying Greenland or annexing Canada as the 51st state, which I have never understood. Why not adopt the ten provinces as states 51-60, or maybe only take the desirable ones with the oil? These tactics set the stage for strategic development. I call it throwing a grenade over the wall, swooping in to assess the chaos, and finally isolating and negotiating the opportunity.
Next, he says, Trump uses quantum superposition, a theory of physics which means the state of something can be whatever you want it to be – “superposition explains how a quantum state can be represented as the sum of two or more states.“ Or, as a friend used to say about the Enron book cooking, “it’s an asset and a liability at the same time.“ An example is when something changes, like a coin flipping through the air. Is it heads or tails? Yes.
The last step of Trump’s “negotiation“ is an unprecedented ability to declare victory, regardless of the outcome. For now, I would say Greenland and Canada are safe from becoming colonies of the United States. The Panama Canal could flip back to our ownership. I doubt the 145% tariff on Chinese imports will stand, but what will the final number be? If it ends with a number different than January 19, 2025, victory will be declared.
Delta Faceplant
In other reversal news, after giving Delta credit for execution last week, I experienced a two-hour delay due to a “software update,“ followed by another hour on the tarmac after someone realized, gee, we should load the bags! So, while people pace and wonder about their connections for two hours while the plane is fixed, the luggage doesn’t move. Kaboom! I would seriously give everyone on the plane a $100 voucher.
Bleeding Edge AI Forecasts
On to more unprecedented AI data center forecasting, last week, RTO Insider featured Around the Corner: The Promise, Uncertainty, and Unparalleled Risk of Data Center Load. Figure 1 shows three-year forecasted data-center load additions, ranging from 45 TWh (26% increase) to 404 TWh (229% increase), compared to a 2023 baseline – in just five years from 2023 to 2028!
Figure 1 Forecasted Data Center Loads
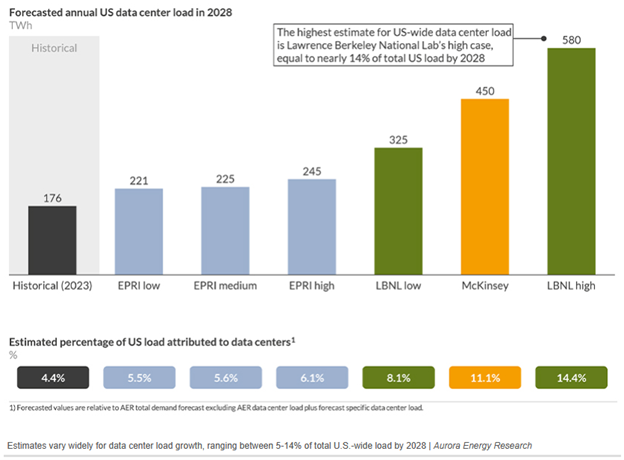 Figure 1 pertains to energy use, but how does that translate to peak load on the grid? The Energy Rant delivers. First, let’s start with the 2023 data, which shows a coincident peak load across the United States of 743 GW. I grabbed my trusty eGRID data and plotted the installed power-generating capacity in the U.S. in Figure 2, which shows a dispatchable capacity (thermal, from coal through nuclear) of 852 GW. Hydro generally has about 50% of its capacity available[1], and the rest depends on how the wind blows, almost literally. As of 2023, The reserve margin on the dispatchable thermal capacity is about 13%. Not bad.
Figure 2 Installed Capacity and Peak Load United States
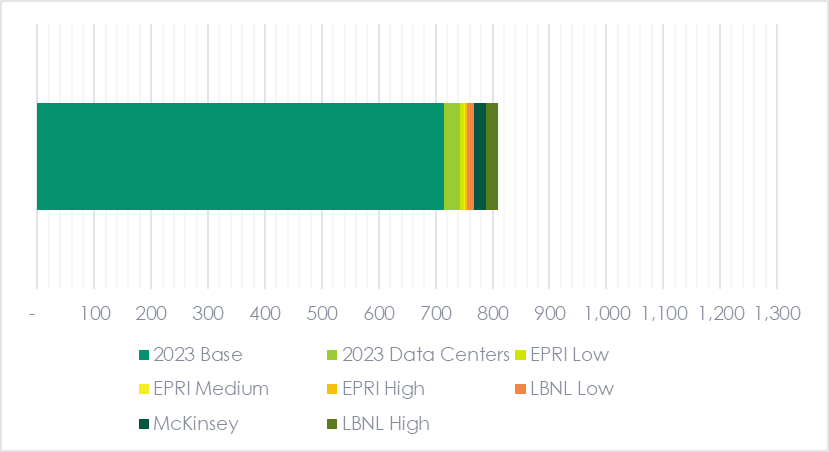
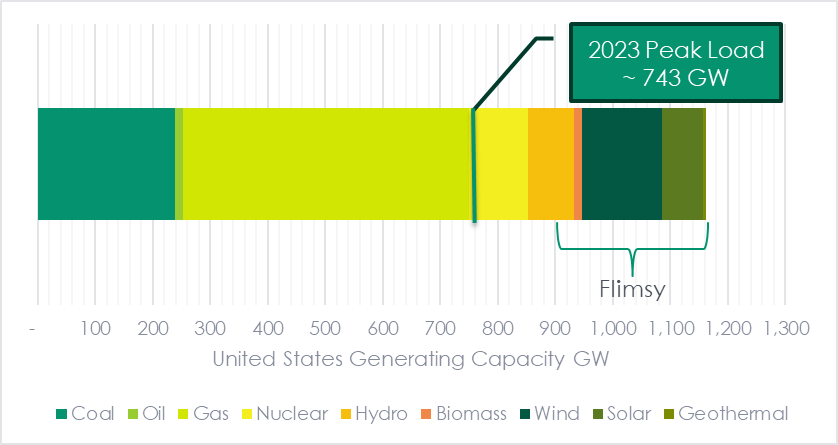 Figure 3 shows the peak loads[2] with the various forecasts noted in Figure 1, from low (EPRI low) to high (LBNL high). Assume the worst-case scenario in terms of reserve generating-capacity margin – the LBNL High model. In that case, we would have a peak load of 809 GW, dropping the reserve margin to a white-knuckle 5%. That would make RTO CEOs soil themselves on a hot, humid, and calm August day.
Figure 3 Peak Load Scenarios
 Eye-Popping Plans
 Eye-Popping Plans
Take another look at the RTO Data Center numbers:
- Dominion Energy reported over 40 GW of data center contracts in Virginia as of late 2024, nearly double their record peak load of 23 GW.
- PPL Corp received 54 GW of requests for service in Pennsylvania and Kentucky—against a peak demand of just 7 GW.
- Oncor in Texas handled 228 interconnection requests for 119 GW, dwarfing its current 31 GW load.
- Exelon reported 16 GW of demand, while individual “hyperscaler“ projects (e.g., Meta’s 2 GW project in Louisiana) illustrate the scale.
These massive potential loads have utility CEOs giddy because they can lock in 15-year contracts with the “Magnificent Five“ data center operators: Alphabet, Amazon, Apple, Meta, and Microsoft, as regulators approve the deals despite the 30-50-year lifespans of generation, transmission, and distribution systems[3][4]. That leaves ratepayers holding the bag if these high and low falutin gamblers go smelly belly up. At this point, no one knows how to make money on AI except the AI enablers – Cat, Trane, Siemens, General Electric, Baltimore Air Coil, Nvidia, etc.- who are now pocketing the money. What’s more, utility CEOs (and commissioners) will be long gone at the end of the contracts with the data centers.
China has a significant advantage over the United States on this front – top-down central planning and construction of everything. In contrast, the U.S. has state and local NIMBY and an administration that doesn’t understand the necessity of regulation[5]. How will it end? It won’t end, but the journey will be interesting!
[1] Hydro’s average capacity factor in 2022 was 36%.
[2] TWh converted to GW load using a load factor of 70%.
[3] 40-50 years per The Wall Street Journal.
[4] 30-40 years per RTO Insider.
[5] A topic for another day.
