
This week, Rant readers get a threefer on 1) self-inflicted opposing policies, 2) common sense versus uncommon senselessness, and FOOD!
Consumers and taxpayers have paid about $50 billion in subsidies to the ethanol industry over the last 40-plus years. Why? Because when the racket began, we were going to run out of oil and natural gas. Today, or at least a year ago, there was an excessive glut of fossil fuel, and we had to decarbonize with renewable energy sources, namely wind and solar, and electrify everything, including personal transportation. I’ve written about those subjects a few dozen times each.
Observe: The government subsidizes liquid fuel for fossil-burning automobiles and light trucks, while simultaneously subsidizing electric vehicles and renewable power generation to fuel the EVs. That, Rant fans, is your brilliant federal energy policy in action. Brilliant.
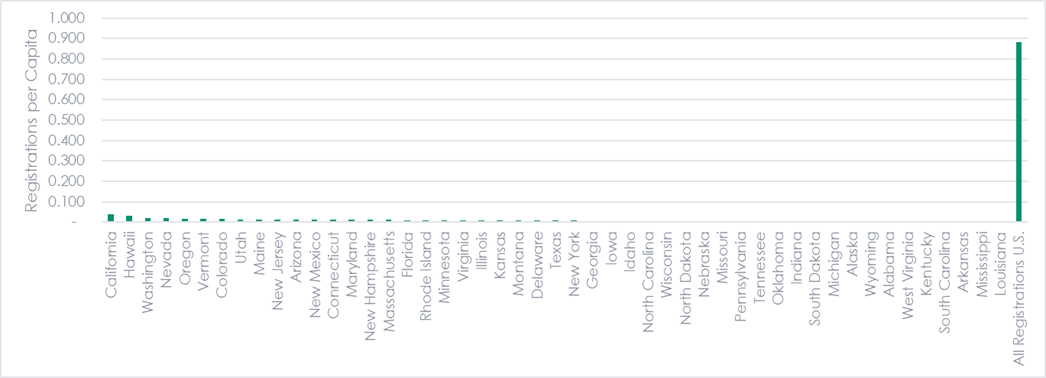
I conducted some research on electrification and found, not surprisingly, that Iowa, a beneficiary of ethanol and wind subsidies and tax breaks, is practical! Who’d have thought? According to Figure 1, Iowa ranks solidly in the middle of the pack, at #28, in terms of electric vehicle adoption. To put that in perspective, I added all registered motor vehicles in Figure 2. Electric vehicles account for approximately 1.4% of all registered vehicles on the road nationwide.
Figure 1 Electric Vehicle Adoption per Capita
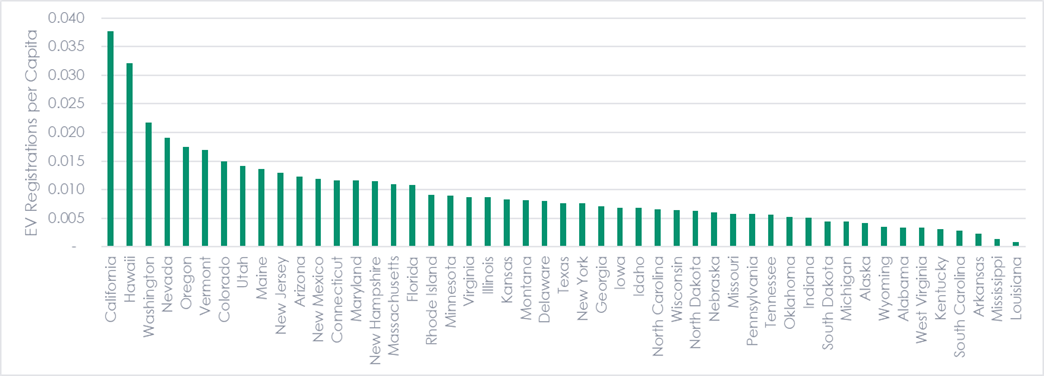
Figure 2 Total POV Adoption per Capita
Embedded Policy Rant
Massachusetts, by contrast, enacted a de facto ban on natural gas pipelines in 2021. As a result (get this), they are importing liquified natural gas from abroad! That is gloriously brilliant. Results:
- Massachusetts wholesale gas prices are 239% higher than the national average.
- Electricity prices are 72% higher than average. Eighty percent of MA electricity is generated by natural gas.
- The 2021 law will be de-toothed.
Well, climate change isn’t that much of a threat, apparently, when a few dollars get in the way.
Corn and Food Prices
Last week, I wrote about direct and indirect subsidies (mandates) for corn-based ethanol. Does this drive up food prices?
First, it’s important to distinguish between the types of corn for human consumption. Here is an awesome chart of all types of corn: sweet corn (corn on the cob), popcorn, dent corn (used in tortillas and chips), and field corn (used in high-fructose corn syrup, corn oil, and starch, among other products).
Table 1 Corn for Human Food Consumption

Field Corn, Animal Feed, and Protein
If you’re a salad eater like I am, I’m sure you’ve heard, “Would you like some protein with that?” Do you mean meat? Yes! (sometimes)
My focus last week was on the nation’s largest crop (1), field corn, which is produced at a rate of about 15 billion bushels, or nearly 400 million metric tons per year. Only about 15% of America’s annual 15-billion-bushel field corn harvest is consumed by humans through ultra-processed food ingredients. The rest is used as livestock feed (beef, chicken, pork) and for ethanol production.
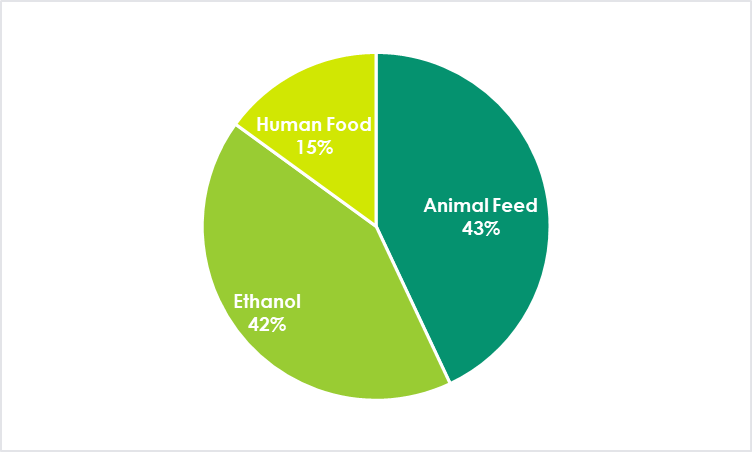
Only a fool would say ethanol’s pull on the corn crop has no impact on food prices, particularly beef, pork, chicken, and eggs.
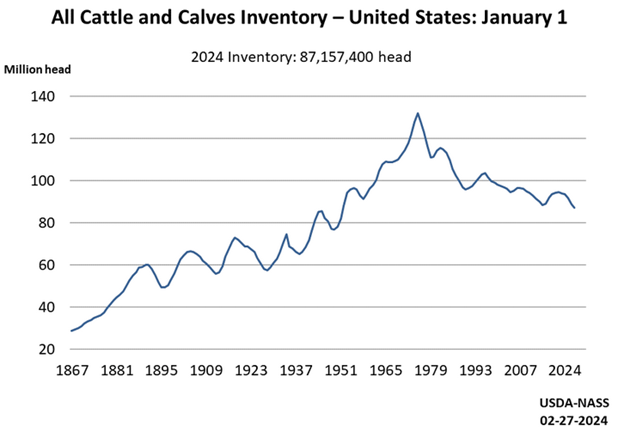
Ya know, I often find data that blows me away when I dig into report findings for these Energy Rants. You’re welcome. For example, I just learned that there are more cattle (Figure 4) in the U.S. than hogs (Figure 5), but that’s only part of the story.
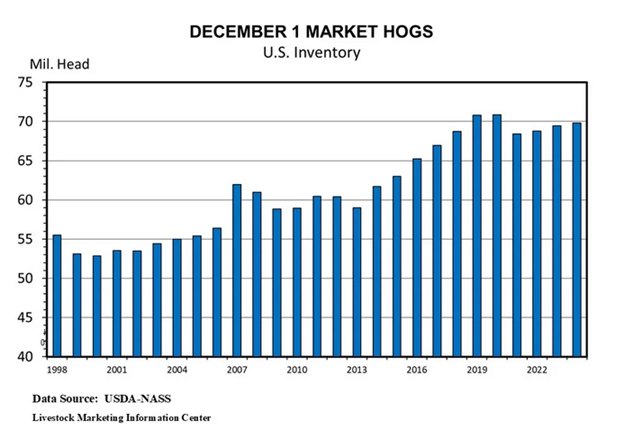
Meat Production Efficiency
I compiled a wealth of data for Rant readers to explore, and I was amazed by the findings. I knew two reasons why beef prices are generally high. One is low proliferation. One cow produces one calf per year with a nine-month gestation period. Sows, on the other hand, pump out 25 pigs per year.
Also, from my days in 4-H, I knew that cattle have a poor feed-to-meat conversion ratio of 10:1. Hogs are twice as efficient, at around 5:1, and chickens are the most productive, at 3:1.
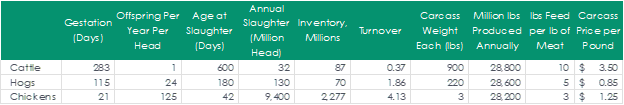
Wrapping it all together, I produced Table 2 Meat Production Facts. The remarkable aspect is that, despite the wide range of inventory and turnover, the total production of beef, pork, and chicken in the U.S. is almost exactly the same.
Table 2 is gold, super-rich, dense data. Wow! Sources available upon request for a low price.
Table 2 U.S. Meat Production Facts
There you are. Cattle:
- Require a lot of inventory
- Are not proliferous
- Grow slowly
- Have poor feed conversion rates
- Require a lot of land
- Are not easily industrialized
- Therefore, the price of burgers, steaks, and brisket will always be high compared to other farm-raised meats (get it, Mr. President?). The President is flying the old canard to have the DOJ investigate “illicit collusion, price fixing, and price manipulation,?” among the big four: Tyson, JBS, Cargill, and National Beef Packing Company. However, I do share this with the President: We love McDonald’s.
This sums up the primary causes of soaring beef prices: nature and policy. Sic the DOJ on narco and human traffickers instead.
References
https://www.ers.usda.gov/data-products/feed-grains-database/feed-grains-yearbook-tables/
https://www.ers.usda.gov/topics/crops/corn-and-other-feed-grains/feed-grains-sector-at-a-glance/
https://www.statistico.com/s/us-domestic-use-of-corn-by-purpose
https://nebraskacorn.gov
1) By acres, yield, and typically, dollar value as well.
