In our first data center post two weeks ago, we covered the core of data centers, including racks, servers, and the exploding computer capacity and heat generation of evermore powerful computing chips. In last week’s second post, we covered the types of data centers, from distributed edge data centers to enormous hyperscale data centers. In this week’s third data center post, we dive into the broad metrics and opportunities to improve the energy efficiency of data centers.
Power Usage Effectiveness
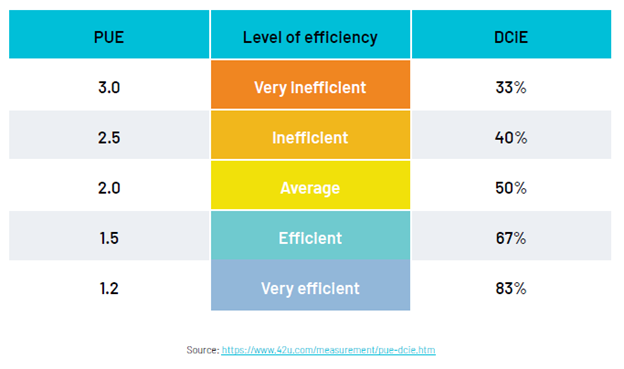
First, I’ll introduce or reintroduce the power usage effectiveness of data centers, or PUE, as follows.
 In general, levels of PUE may be bracketed as follows:
 Ambient Climate Affects PUE
I wrote “in general” because having a lower PUE and more efficient data center in Tacoma, Washington, is easier than in Houston, Texas. Houston has about 10X the cooling degree days compared to Tacoma, but as importantly, Houston has a much more tropical climate, making heat rejection from energy-guzzling computer chips more difficult.
Cooling degree days indicate a sensible cooling load, which is temperature-dependent only. Think of the dry heat in Phoenix versus the humid heat in Miami. They are not the same. Ninety-nine degrees in Miami is much more dangerous for outdoor exercise or exertion than it is in 99F conditions in Phoenix. Cooling degree days measure temperature-difference loads (aka, sensible loads) but not humidity-related loads (aka, latent loads), which can be substantial.
Cooling degree days, or CDD, is the sum of the temperature difference measured outdoors and 65 degrees Fahrenheit every hour, divided by 24 to convert heating-degree-hours to heating-degree-days. Maybe by the time I retire, I’ll remember how to spell Fahrenheit.
 For example, if it’s 90F outside for 10 hours and 70F outside for 14 hours, the HDD is 13.3. The HDD approach is the dumb measure of cooling load or capacity to reject heat. Your capacity to reject heat (stay cool) is much greater in 99F Phoenix weather than in 99F Miami weather. Humid Miami air can hold 50% more energy than dry Phoenix air. The higher the energy content of air, the harder it is to dump heat into it, and therefore, the cooling can be less efficient, all else equal. This is critical to data center PUE, which we will return to.
A Better Look at PUE
Let’s circle back to that PUE chart above. Energy consumed in a data center consists of three things:
- IT equipment
- Cooling the IT equipment
- Lights, switchgear, and uninterruptible power supply
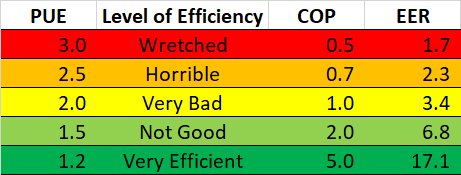
Computers don’t need lights to operate, and uninterruptible power supplies consume only 5% of computing load. Therefore, we predominately have computers and cooling the computers as significant electric loads. I recreated the above PUE chart as follows:
 With the simplification described above, I converted the PUE to the coefficient of performance (COP) and the corresponding energy efficiency ratio (EER) with which most readers are familiar.
The coefficient of performance, COP, is the ratio of Btus of cooling (or cooling rate) divided by the Btu content of electricity used. It is unitless.
 The energy efficiency ratio, EER, is similar but is not unitless. Using head math, the EER is 3.413 x COP.
 Cooling Efficiency
Why did I convert PUE to COP and EER? To gauge cooling system efficiency. For example, a COP of 5.0 is very good. That would require a water-cooled chiller and effective use of free cooling, also known as an economizer. Opening your windows at night for comfortable, cool sleeping is free cooling. There are many more effective ways to squeeze free cooling into a facility. I’ll come back to that.
A PUE of 1.5 is not good, as that would be the efficiency of a direct expansion rooftop unit with mediocre free cooling capability. These rooftop units are common with box stores like Target, Walmart, Lowes, Menards, or Best Buy – except those facilities have comparatively microscopic cooling loads.
The State of PUEs
So, what are typical PUEs in the industry? Thank me for asking. According to the Uptime Institute, PUEs have been bebopping around 1.5 to 1.6 in the “not good” category for about ten years.
 Uptime states, “For many data center industry watchers, including regulators, this flatlining has become a cause for concern — an apparent lack of advancement raises questions about operators’ commitment to energy performance and environmental sustainability.”
This is the challenge for data center owners, operators, and leasers. While many claim to operate in the 100% clean energy hall of mirrors, if they were wise, they would minimize energy waste (where have I heard that before?).
Designs Differ
In my brief research, there are vast differences in the operating efficiencies of data centers, specifically with their cooling systems. Efficiency differences are due to system design and equipment choices rather than magical tricks operators deploy. How can designers, builders, and data center owners minimize waste? The answers are system design and choosing big-ass multi-phase heat rejection systems. We will get specific on these tricks next week.

 Cooling Efficiency