Does more industrial [or commercial or residential] energy efficiency lower energy prices for all? That is a partial title of a paper published at the 2015 Summer Study on Energy Efficiency in Industry[1]and the source of last week’s sassy DRIPE post ( DRIPE = demand reduction induced price effects). DRIPE is a measure of the value of efficiency delivered via downward pressure on energy prices, in this case, electricity prices. The ACEEE conference paper notes that industrial customers could help drive prices for everyone lower through greater demand response through real-time monitoring, smart technologies, and load visualization. This sounds like grid-interactive efficient buildings to me.
As described last week, regional transmission organizations (RTOs) use generation resource (supply) stacks in reverse auctions to buy from generators and sell to retail markets at the lowest possible price every minute of the day. When plotted from cheapest to most expensive, the supply stack forms a curve that is quite smooth.
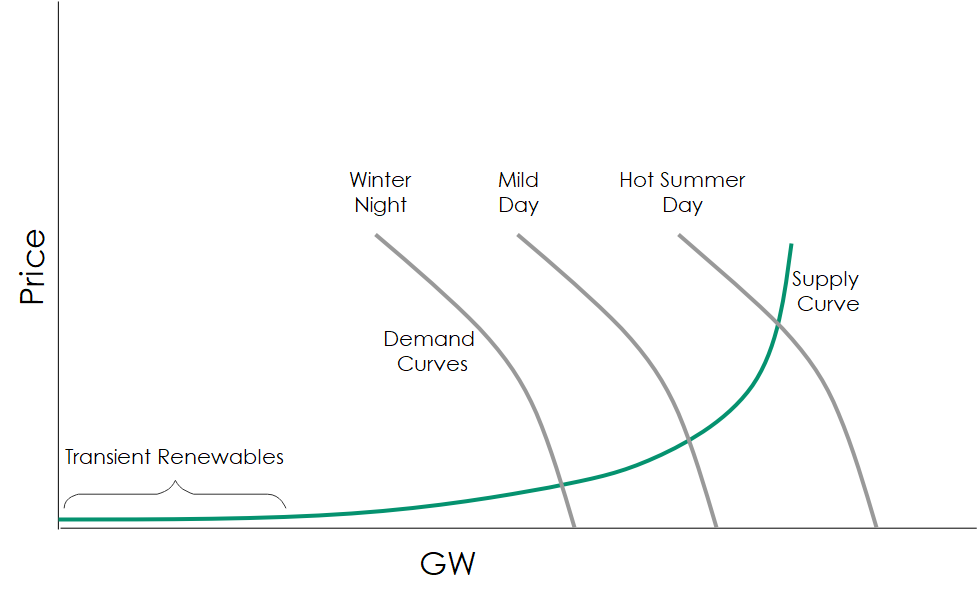 Last week, I was careful to point out that IF customers paid the same constantly fluctuating price RTOs paid, the demand curves might be smooth, as shown. The supply curve moves left to right as renewable energy (the portion on the left) ramps up and down with sunshine and wind. I show that part with the bracket labeled transient renewables. Likewise, the demand curves move around with the time of day, day of the week, and weather conditions.
Efficiency Benefits and Impact on Prices
Last week I simplified the ratepayer impact measure (RIM) test to say that it always fails for efficiency portfolios. The benefits are avoided primary fuel charges that are always less than lost utility revenue plus program administration and delivery costs. Virtually the only way to get RIM to pass for efficiency portfolios is to decrease revenue, so the utility goes bankrupt. See why it never passes?
The nearsighted person, both in terms of time and space, sees efficiency drive up costs for those who choose not to participate in programs. It’s like saying the gym membership and the health coach have a negative return on investment because it costs more now to save you from diabetes, heart disease, and cancer thirty years from now. Who buys that? Nobody.
Like wellness, DRIPE is a measure of the avoided heart attack, amputation, and blindness due to heart disease and type two diabetes years into the future (time), plus productivity gains through feeling better and having a prosperous home life (space).
DRIPE-Related Benefits
First, RIM and other benefit/cost tests seem to ignore that efficiency reduces cost at the margin – the last, most expensive kW/kWh the RTOs must buy to put on the grid. Says the ACEEE paper: “DRIPE reduces the marginal cost of electricity as it exposes market inefficiencies by substituting lower-cost energy efficiency for higher-cost supply.” Boom!
Second, DRIPE benefits all customers. Although the estimated price suppression may be only a fraction of a penny, when multiplied by the consumption of every customer, the savings are vast. For example, the ACEEE paper references a study that estimated statewide customer savings to be between a half billion and one and a half billion dollars statewide in New York. A 2013 ACEEE Study estimated DRIPE savings to all Ohioans by 2020 for their programs would be $900 million to $1.3 billion. I’ll bet the racketeering Mafioso cabal[2] that killed efficiency via HB6 in Ohio didn’t factor that into their equations.
Third, DRIPE accounts for spillover savings beyond the brothers and sisters connected to the utility’s poles and wires to long-lost cousins, second cousins, and strangers throughout the country. Reduced primary (electricity) energy consumption reduces secondary (natural gas, coal, fuel oil) fuel consumption across the region into neighboring states or even an entire swath of the country. For now, and a long time forward, marginal electricity, the last kW/kWh supplied to the grid, requires fuel. Saving electricity saves fuel, and that reduces costs far and wide. States in the Northeast – Massachusetts, for one – use these savings in program benefit calculations.
Forth, DRIPE includes reduced transmission and distribution (T&D) line losses. See The $900 per Gallon Avoided kWh for a quick lesson on how line losses increase exponentially with increasing electrical current flow. Reduced T&D losses save today, while accumulated over time DRIPE savings would include avoided T&D capacity expansion cost – non-wire alternatives, or some other term de jour.
Fifth, DRIPE mitigates crises, again by gnawing away at the margin where crises reside. It is less expensive to trim demand via demand response or grid-interactive efficient buildings than acquire power during system peaks. In some cases, as ACEEE notes, load reduction via DR and GEBs is the only option. The paper points to a resolution to California’s electricity crisis in 2000, followed by a 14% demand reduction the following year resulting from demand response and efficiency. Incidentally, 14% is not far from the reserve margin (capacity minus demand)/demand) grid operators like to maintain for reliability. This works for natural gas too. People moan all the time about gas programs because they’re not cost-effective. That’s because the models are lacking. The ACEEE paper notes DRIPE from efficiency programs saved Midwest natural gas consumers a billion dollars in the mid-aughts natural gas crisis (that we are reliving today, 2021, with skyrocketing prices).
Closing Statements
The referenced ACEEE paper notes that efficiency [and demand response] “exposes market inefficiencies by substituting lower-cost energy efficiency for higher-cost supply.” That’s quite a statement, but do the state commissions know this and believe it? Monopoly status comes with obligations to make way for lower-cost resources. Does anyone disagree with this statement?
Policymakers, lawmakers, and even insiders of our industry seem to look for ways to beat down the benefits of efficiency and demand management programs. See the recent Socially Undesirable Net Savings for examples of these beatings. Let’s reverse the beatings and add efficiency and DR impacts to the benefits side of the ratio!
[1] Delivered by the American Council for an Energy Efficient Economy
[2] Hundreds of other articles posted on this topic.