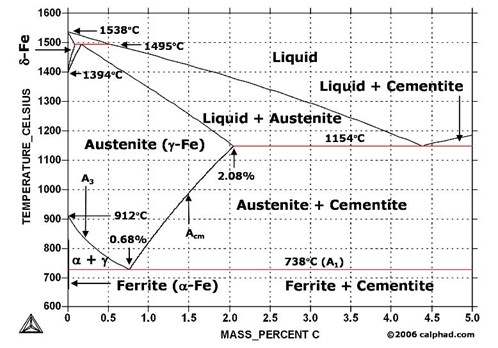
As undergraduate mechanical engineering students, we took materials science courses and studied phase diagrams like the one below from “Metallurgy for Dummies.” Does that appear to be dummy-grade to you? It gave me a chuckle.
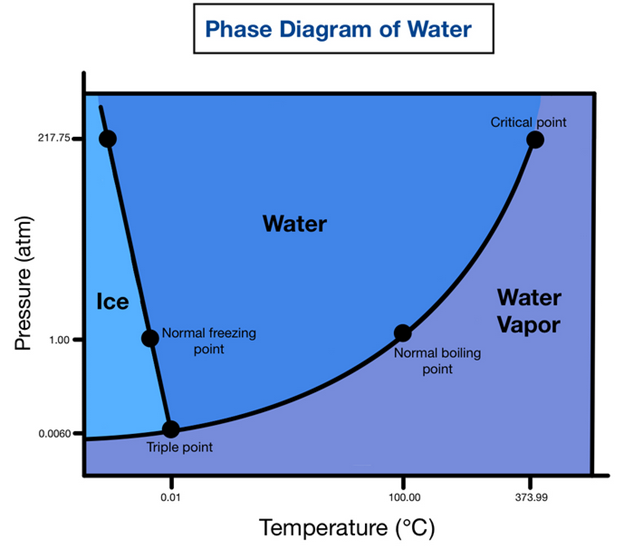
 A phase diagram for water (below) is decidedly simpler. The above diagram shows only liquid and solid phases of carbon steel, while the water diagram shows its three phases, solid (ice), liquid, and vapor (steam). The author writes, “Freezing Point: At a temperature of 0 °C [32 °F] and a pressure of 1.00 atm, this is the point at which water (liquid) freezes into ice (a solid).”
 You’d think. But that is not the case for bottled phase change materials which are the working fluid of thermal energy storage systems, aka “thermal batteries.” Without catalysts to spur nucleation (freezing), water at 1.00 atm can remain in liquid form below mmm, 25F. Other phase change materials behave similarly. To demonstrate, I took to my lab for proof. The demonstration is simple. The physics, if you dare to explore, will blow your mind.
