The old adage, “You can’t manage what you don’t measure”, is the heart of systems for metering, monitoring, and controlling electrical energy use and other forms of energy. If you don’t know what is happening, you can’t influence what is happening to your benefit.
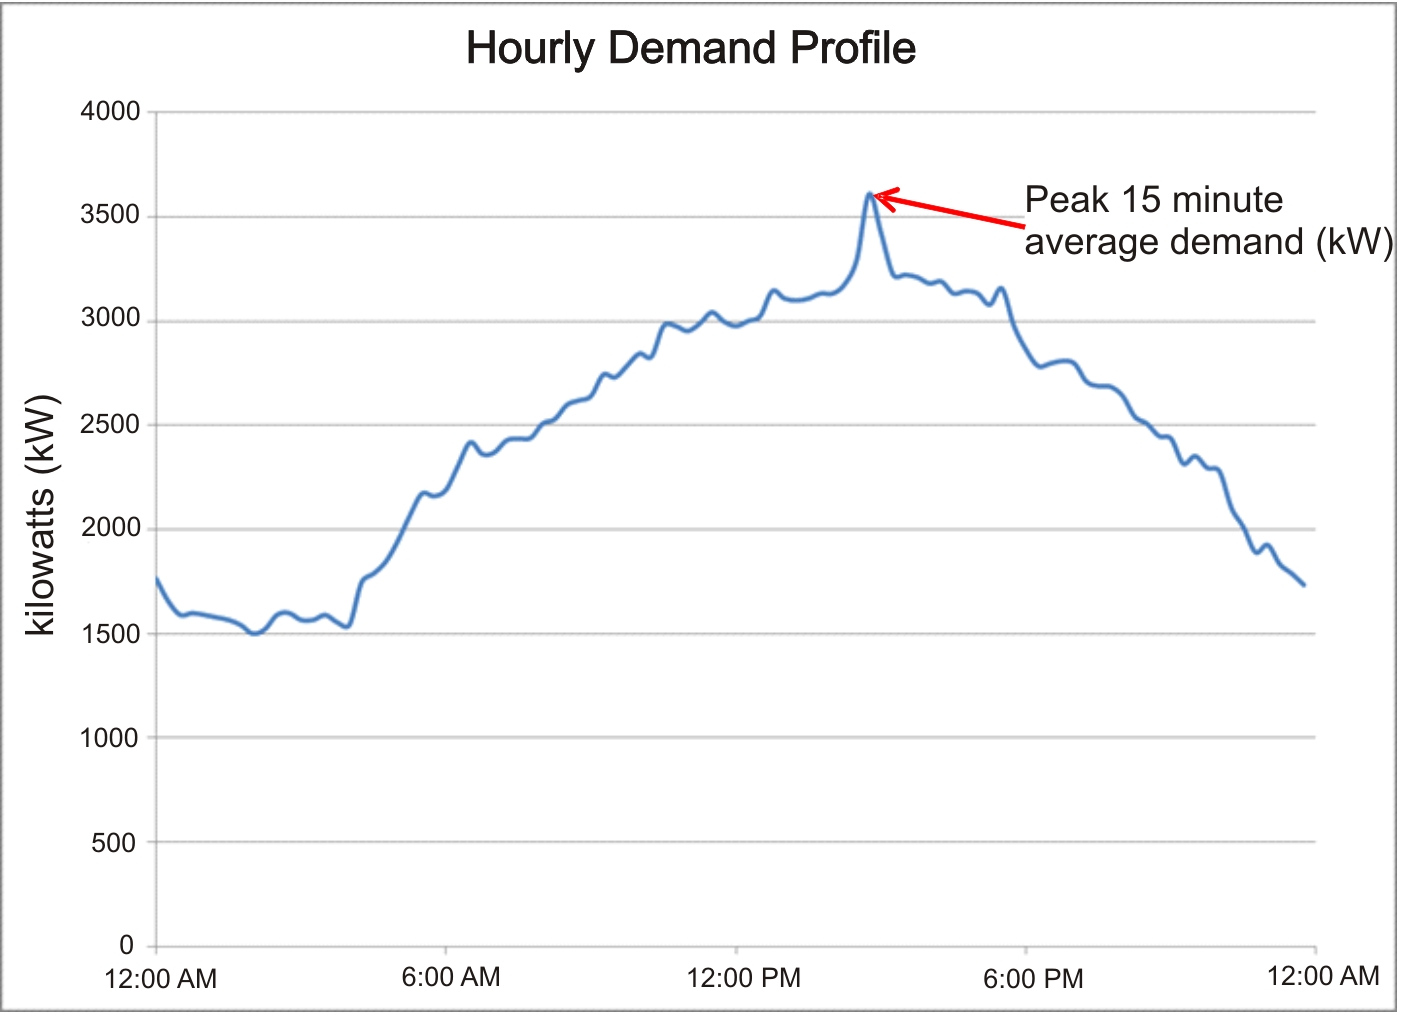
This is especially true with electric use, which typically has two dimensions that are metered and used for billings by utility companies – an instantaneous demand where use is usually averaged over a short time window of 15 or 30 minutes (e.g. 62 kW), and the cumulative energy use over a longer billing period (e.g. 2,568 kWh over 28 days). To control demand, the instantaneous demand and the anticipated profile for the remainder of the averaging period must be known in real time or near real time. Having this information, the user can relate high demand periods to situations in the facility and take action to mitigate or eliminate a future recurrence, potentially reducing future demand charges.
Similarly, using the same data, facility managers can identify when energy is being consumed and relate that use to specific operations. They can then make necessary operational changes to reduce the cumulative energy use. In the graph, daily energy use is the total area under the curve for the day.
The issue for most businesses is the lack of timely, viewable, and manageable electrical information. Getting the information on the bill up to 45 days later is nearly useless for true management of electric costs. The good news is data are usually available in very useful and manageable formats at costs that make sense for many users. Utilities can make their metering information available as pulse inputs for energy management systems. Some utilities also provide an on-line viewing service for the demand and energy uses. Additionally, businesses can install their own data collection systems independent of the utility with features they may need and want for their unique control strategies (e.g. equipment management priorities for demand control). A reasonably robust data and control system can collect, store, manage, and control many other systems where a meter point (compressed air horsepower, production counts, temperatures, flow etc.) is generating a data stream. These data allow the facility engineer to truly manage systems and ultimately, energy costs.
More sophisticated users will recognize the opportunities with a continuing data flow and consider how statistical tools could be used to test and manage equipment operations. The key issue is using interval (demand) data in real time to identify events or operations that are causing high demand (KW) or energy (kWh) charges on bills and managing these events to reduce cost.