
For those of you who are not doctors or veterinarians for our beloved pets, have you ever been in an exam room when the technician brings in X-RAY results and posts them on the backlit thing and leaves you alone with them before the doctor arrives? I was in this situation a year or two ago. Looking at the image was like reading brail with my eyes – but that doesn’t stop me from trying. Oooh, what is that? Is this a problem? Is that out of whack?
The doctor blew over what I was looking at because I was clueless, other than “Yep! That there is a pelvis!” Reading bones is like reading analytics. You have to know a lot of stuff.
Analytics
Does the term “analytics” make your eyes roll back into your head and then glaze over? Me too. I recently witnessed a presentation entitled “Analytics is More than FDD (fault detection and diagnostics).” What is FDD? Short answer: check-engine light, like the one that’s been lit in my Acura for years. The car works great and gets great mileage. The technician said it’s probably a sensor that will cost $1,000 and tell me nothing is wrong. I’ll pass on that deal.
In buildings, FDD systems can monitor dozens, hundreds, or thousands of monitoring points (input and output) throughout a building automation system. An input signal is a read of what is happening. The output is a response to tell the system what to do. For instance, your brain (via your nose) may tell you something is burning: input #1. Further diagnosis may include your brain telling you it’s your hand on the stove: input #2. Ok. Your brain tells your arm to lift your hand off the burner: output, or response. This is the essence of a control system.
The challenge to this day is handling data. Dashboards are pretty and interesting. They make you think, “Oooh, that’s cool. I could really use that!” But once you buy and dig in, you find the warts. This happens with every software I’ve ever evaluated, purchased, or used for free[1].
Brains and Computers
I watched a webinar on business and industry disruption – you know, things like Uber, the iPhone, and Netflix. The guy said there’s nothing new or disruptive about AI (artificial intelligence or machine learning). It’s been around for decades. I agree. People can spend millions or billions building a computer like Watson, the champion of Jeopardy. But computers will never, ever, outsmart a human brain in instantly and effortlessly detecting patterns or computing where to be at a precise time, like an outfielder catching a long ride to the warning track and spearing the ball in flight, or reading the mood of your dog. Remember mood rings?
Driving is similar. Most people would throw up riding with me through the woods of Wisconsin with dozens of sharp blind corners in the dark this time of year. Why drive so fast? Why ski so fast? Why the roller coaster? Drive like you mean it, I say, not like a dumb computer. The brain can predict what a driver is likely to do next by quickly detecting subtle patterns of drivers nearby.

The automation of data manipulation is good and can save a lot of grunt work, but in the end, nothing beats an experienced brain to assess what is happening. I’ll use an example of a project I did decades ago. By the way, this was for one of those utility-sponsored performance contracts I mentioned in recent posts. See #2 from Gene Simons, and #8 from Mark Twain.
I had data from a compressed air plant, including four air compressors, total power in kW, and total airflow in scfm, cubic feet per minute at standard (the s) atmospheric conditions. I had never been to the place. Someone else collected and supplied the data to me.
In the first chart here, we see the total kW of the plant versus time. They shut down over the Memorial Day holiday.
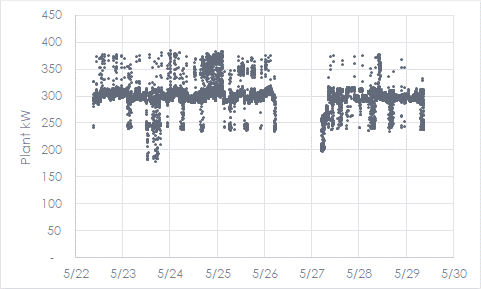
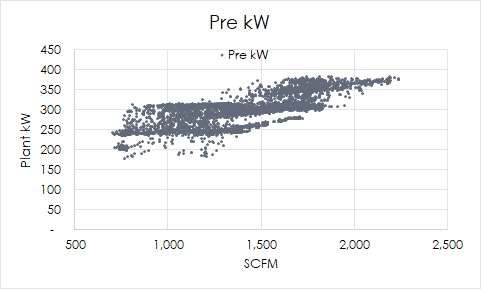
This tells me nothing. The next chart shows the plant kW versus plant flow. The best AI algorithm can’t even tell that there looks like an F-18 Super Hornet fighter jet. The tuned brain with a background in compressed air performance curves can see the operating regimes by which the plant meets compressed air demand. I had detected eight regimes, or eight combinations of various compressors running and how they were controlled. My reading of the data is like the doctor reading my bones.
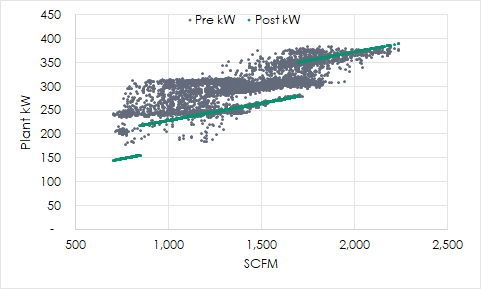
The next step is taking what you have for compressors and how they modulate their compressor flow and optimize it. This looks like the following. Take every gray dot and subtract the green dot at any flow to determine the savings. This is quite visual, right?
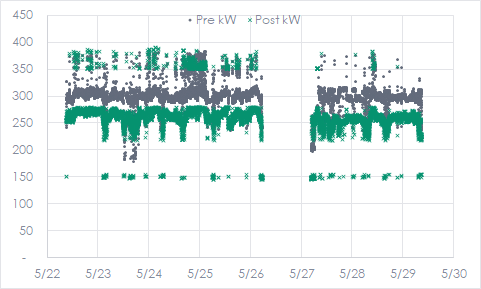
In another visualization, see below for pre and post kW versus time. This is another way to ensure the results look realistic. Victory at last!
Nerds may be thinking, this isn’t FDD. Perhaps, but you will need your brain and knowledge of the system to determine what is happening given the data presented. Consider the Three Mile Island incident. The FDD was there, but the operators drew erroneous conclusions resulting in fuel damage.
Computers are useful for many things: storing and processing gobs of data, sounding alarms, and repetition: tireless delivery of grunt work. That is their purpose. Pattern recognition, creativity, and problem-solving are the domains of brains.
[1] Free usually sucks, is my rule of thumb.
