
A couple weeks ago in Renewable Energy, Bad Parents, and Strawberries, I wrote that the value of an electrical generating resource depends a little on how cheaply it can produce energy (kWh), but a LOT on when and the (new word alert) dispatchability of the resource. For instance, California already has so much solar generation at the wrong time of day that it needs to dump kWh by paying producers to quit. This is demand response in reverse, or (new term alert) supply response. Yes, they are curtailing less than 1% of sales, but they are also two years ahead of the duck curve[1]. What to do? Keep going!
Jamming that much renewable energy down the duck’s throat is also putting a big pinch on benefit/cost ratios for energy efficiency. It is difficult to be cost-effective when the savings are negative due to negative prices. Joining the negative-price parade are Texas (wind), Arizona (solar), and soon, the Midwest (wind)[2].
Brute Force Green
The image to the right illustrates my sentiments of the situation – efficiency and demand response standing around looking at the sexy brute force greeny guy, thinking, “what about us”?
Smart Green
This article talks about the amazing efficiency of the human body and butterflies, as well as the need to do way more efficiency before renewables. I always seek to amaze readers, so consider that elite marathoners’ hearts pump about 10 gallons per minute, or the equivalent of about 1.5 barrels of beer per mile. The power required for that flow is about 10 Watts. Dude, you think an LED is efficient?
Ok.
Quiz: What was the easiest course for you in college? Stop. Do it.
What was the most interesting course in college? Stop.
Were they the same course? Hell no!
The basket-weaving efficiency measures have nearly saturated the market. It is time to move to the main course – the one course in your beloved college career that epitomized why you do what you do. For me, that was thermodynamics where everything was about efficiency; output divided by input.
Energy and Peak Load Reduction from Controls
I will keep bellering this until I retire, and if people don’t get it by then, I won’t retire. Buildings everywhere are messed up and wasting energy. They don’t need more stuff. They need brains. The cost? Practically free. The environmental impact? A lot better than solar panels and windmills.
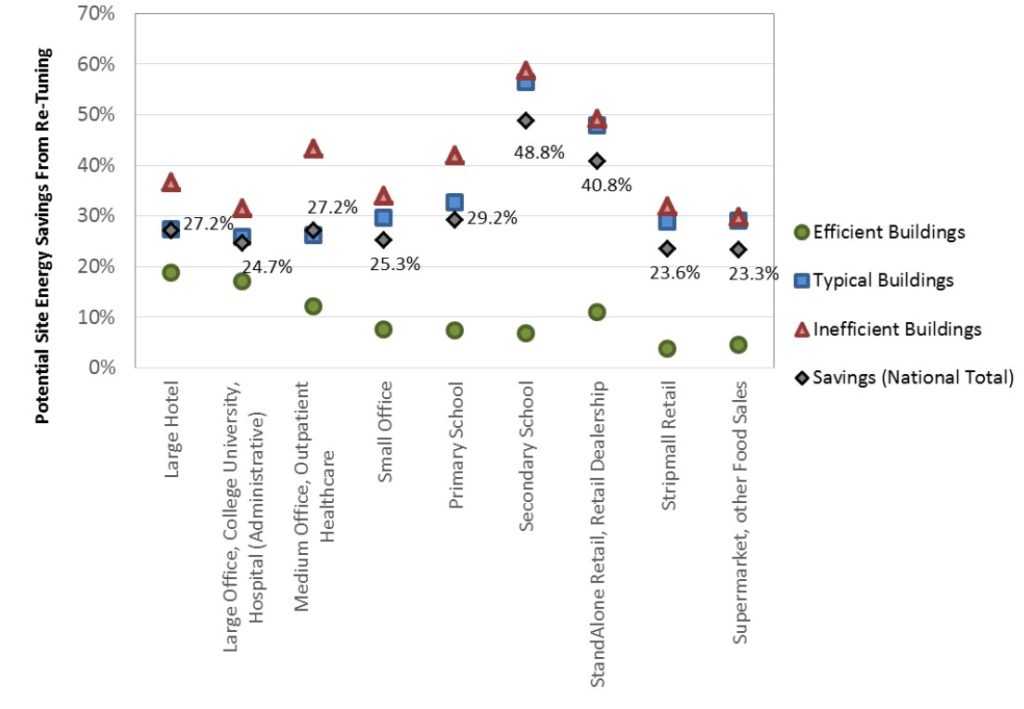
The Pacific Northwest National Lab’s (PNNL) recent report estimates savings in existing buildings to be consistent with my recent post; Buggy Whip Bites the Dust. Energy savings potential: 30%. Demand savings potential: 20%. Specifically, the energy savings break down as shown in PNNL’s chart below.

Mysterious Savings Measures
Not to disappoint, let’s talk about top savings measures reported by PNNL. They happen to be parallel to the measures we are working on right now with a real building; a hospital, in fact.
Deadbands and Setbacks
This measure would make a great name for a band, would it not? The concept of a deadband is simple. You set your home to heat to 70 degrees and cool to 75 degrees. Your deadband is five degrees. This is good. It’s an efficient deadband and provides comfort for the season. However, for commercial buildings, there is a lot more potential to widening the deadband.
The building we are evaluating now has deadbands of one degree. If you were a heating and cooling system and had to control yourself to that standard, your path would be a guy-wire across a river. If, on the other hand, your deadband were five degrees, it would be like walking on a two-lane concrete bridge over the river. The one-degree scenarios will have a control system that tends to heat, then cool, then heat, then cool. It just can’t stay on the wire. Fix it!
Setbacks are also simple. When your house is 60F inside, and it’s 30F outside, it loses less heat than when it’s 70F inside. Setback temperatures are often surprisingly meager. Buildings with gas heat especially should be aggressively controlled for setback.
Minimum Flow Control
Common large central systems, e.g., systems that handle an entire floor of an office building or a classroom wing of a school or college, deliver 55F air to each room; year-round in some cases. To control temperature, we want to effectively reduce the flow to the minimum required for occupant ventilation or to meet the cooling load. In most buildings, too bad. The minimum flow is set too high. The system over-cools, using electricity in the summer, and then has to heat downstream for space temperature control – Phoenix to Minneapolis, it happens. Dumb. As a bonus, it wastes fan energy! Fix it!
Wild Card
Not mentioned in the PNNL report are wild cards. Why? Because you can’t make this stuff up. On the other hand, wildcards exist in every building. Want an example? Great!
Same building discussed above, and this happens all the time: the old surgery suites are now the CEO’s office. See? You can’t make this up. It’s a 100% outdoor air ventilation waste of energy, and we see things like it all the time.
Moooooo!
Thirty percent. It’s everywhere. You just need to know what you are looking at and know what you are doing.
[1] One percent? Sounds suspiciously like a typical demand side management savings target, as a percentage of sales.
[2] I will detail the causes, costs, and risks of negative pricing in a future post. Why? Because nobody else does.
