Energy benchmarking compares a facility’s energy usage to some other facility, an industry average or “best in class” facility, or to previous years for the same facility. Benchmarking usually uses a measure such as kWh per square foot of facility, therms per square foot, or Btus per square foot. These comparisons can be very revealing. For example, comparing stores within a chain may reveal high energy users that are eroding profit. Comparing a facility’s energy intensity with previous years may highlight the need for better maintenance or the need for equipment replacement or failed controls. Comparing a facility to a “best in class” facility may identify an opportunity to save energy. A previous brief on energy benchmarking provides more general information about the topic.
A New Application
Recently, Michaels has developed a new approach to benchmarking. This approach uses benchmarking to screen facilities for energy efficiency opportunities. By obtaining basic information such as building size, annual energy consumption, and type of HVAC system, we can determine the energy intensity for the facility and compare that intensity to the average for similar facilities in our database. We normally establish a target of 10% below the average to determine potential for saving energy. We chose 10% below the average because our experience shows that a 10% reduction is achievable in the vast majority of facilities using our database of facilities.
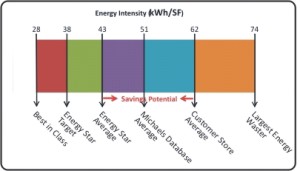
For example, we recently benchmarked a supermarket chain. The chart shows the energy intensity for supermarkets in the climate zone.
This comparison revealed a significant potential for energy savings. We also applied this technique to identify the high energy users within the chain. Potential energy savings were then quantified for each store by comparing to a target. In this case, the Energy Star average was chosen as the target since this is a national average and it accommodated the product lighting desired by the chain management. This procedure revealed the potential to save over $2 million annually.
Customer Types
Our engineers have applied this process to screen end users in all types of facilities including hospitals, schools, retail, office buildings, and manufacturing. The approach for manufacturing is slightly different due to process loads within facilities.
Limitations
Benchmarking provides a qualitative answer. It is not an audit and only identifies potential. An on-site study is necessary to refine the estimated savings and provide a measure list of actions necessary to achieve the savings.