It’s Halloween. Hundreds of thousands of people have to figure out a different costume because a clown plague has infected the country. While I don’t consume tabloid news, I did hear that in some cities, the clowns are getting beat up. I thought, now that isn’t a bad idea, but I wouldn’t advise that. When I was a kid, Halloween antics included dozens of mushy tomatoes and cucumbers left behind in the garden. These have the impact of water balloons, and they make a fine mess.
For this post, I referenced my program booklet for ACEEE’s 2016 Summer Study on Energy Efficiency in Buildings. I realized there were ten(!) papers on the subject of benchmarking commercial buildings. Welcome to the party, I say. We have been using benchmarking data for more than 12 years to identify gems in the rough.
What Is Benchmarking?
In the context of energy efficiency, benchmarking is the comparison of energy use per unit of conditioned, occupied floor space. I highly prefer separating electric (kWh) from fossil (therms, gallons) and thermal energy sources like district steam (lbs) and chilled water (ton-hours). Other methods lump it all together in one unit of kBtu[1]. Lumping everything into one kBtu number erases important information including indications of which fuel type is being wasted more egregiously. Why would anyone do that? I don’t know.
What are the Barriers of Sound Benchmarking?
I noted to myself in one of the ACEEE presentations something very profound, but yet, not surprising to me. A presenter discussing New York City’s findings said the most difficult challenge to benchmarking decency was the accurate determination of conditioned floor space – square footage. I mentioned the larger context of benchmarking challenges four years ago in Lessons from NYC Benchmarking. The challenge is, one building may be served by multiple meters of any given type (e.g., electric), or one meter may serve multiple buildings. Monkeys cannot effectively do this work.
For example, we were recently benchmarking a hospital for savings potential for retro-commissioning. We landed the basic information including square footage and billing data for a period of at least a year. We determined something was amiss. It is possible we have the correct information but improbable. As I recall, the electrical intensity was 30-40% lower than we would expect.
My hunch was that we were missing data from a meter that was overlooked, resulting in a substantial portion of the building having zero energy intensity per our calculations. Our choices were to go up there and do the retro-commissioning investigation or ask our client to find something that may or may not exist. Eventually, we did realize the latest addition had its own meter. Adding this to the recipe resulted in demonstrable savings potential.
This was a rather subtle scenario compared to the findings of city benchmarking results showing variances of 4:1 or more for common building types. So, you can imagine the preening required for those large data sets.
NYC Findings
The purpose of the ACEEE paper, Benchmarking and Audit Data Inform Building Science is to examine the effects of the NYC benchmarking effort that began in 2010.
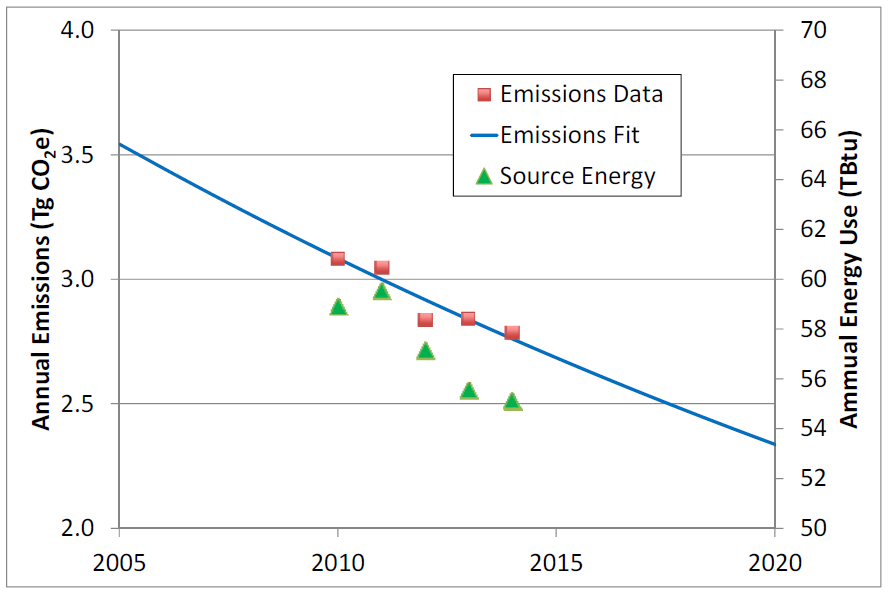
The first finding is that for the buildings that were benchmarked all five years of the study period, energy consumption declined by 6.5%. Is that statistically significant? I don’t know, but the first plot on the left includes data for 2,300 buildings, and the trend is quite consistent from year to year.
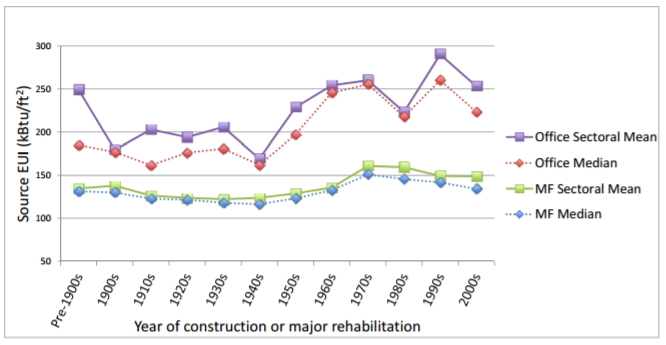
Second, as I reported in Commercial Code Compliance and New Construction Program Failures, buildings are becoming less, not more, efficient as shown in the second plot.
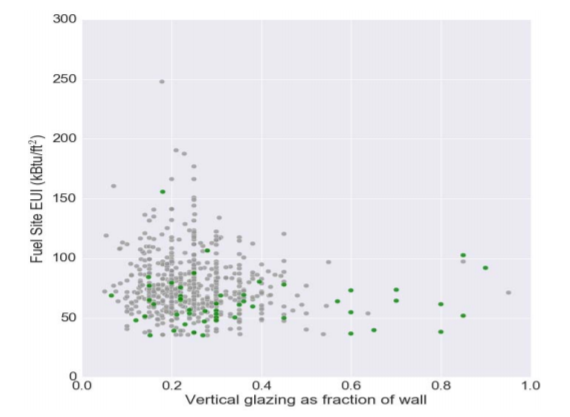
Third, envelope performance is poorly understood as a result of data shown in the third chart. The data represent audited multi-family buildings with heating fuel use (vertical) as a function of percent glazing (horizontal). All buildings represented have double-pane windows. The green dots represent buildings built since 1990.
If theory held, this plot would show a steady rise in heating fuel consumption as the percent of glazing increases. The data show the opposite. I don’t have the data, but it is safe to guess a crude linear fit would show decreasing heating fuel consumption with increasing window percentage.
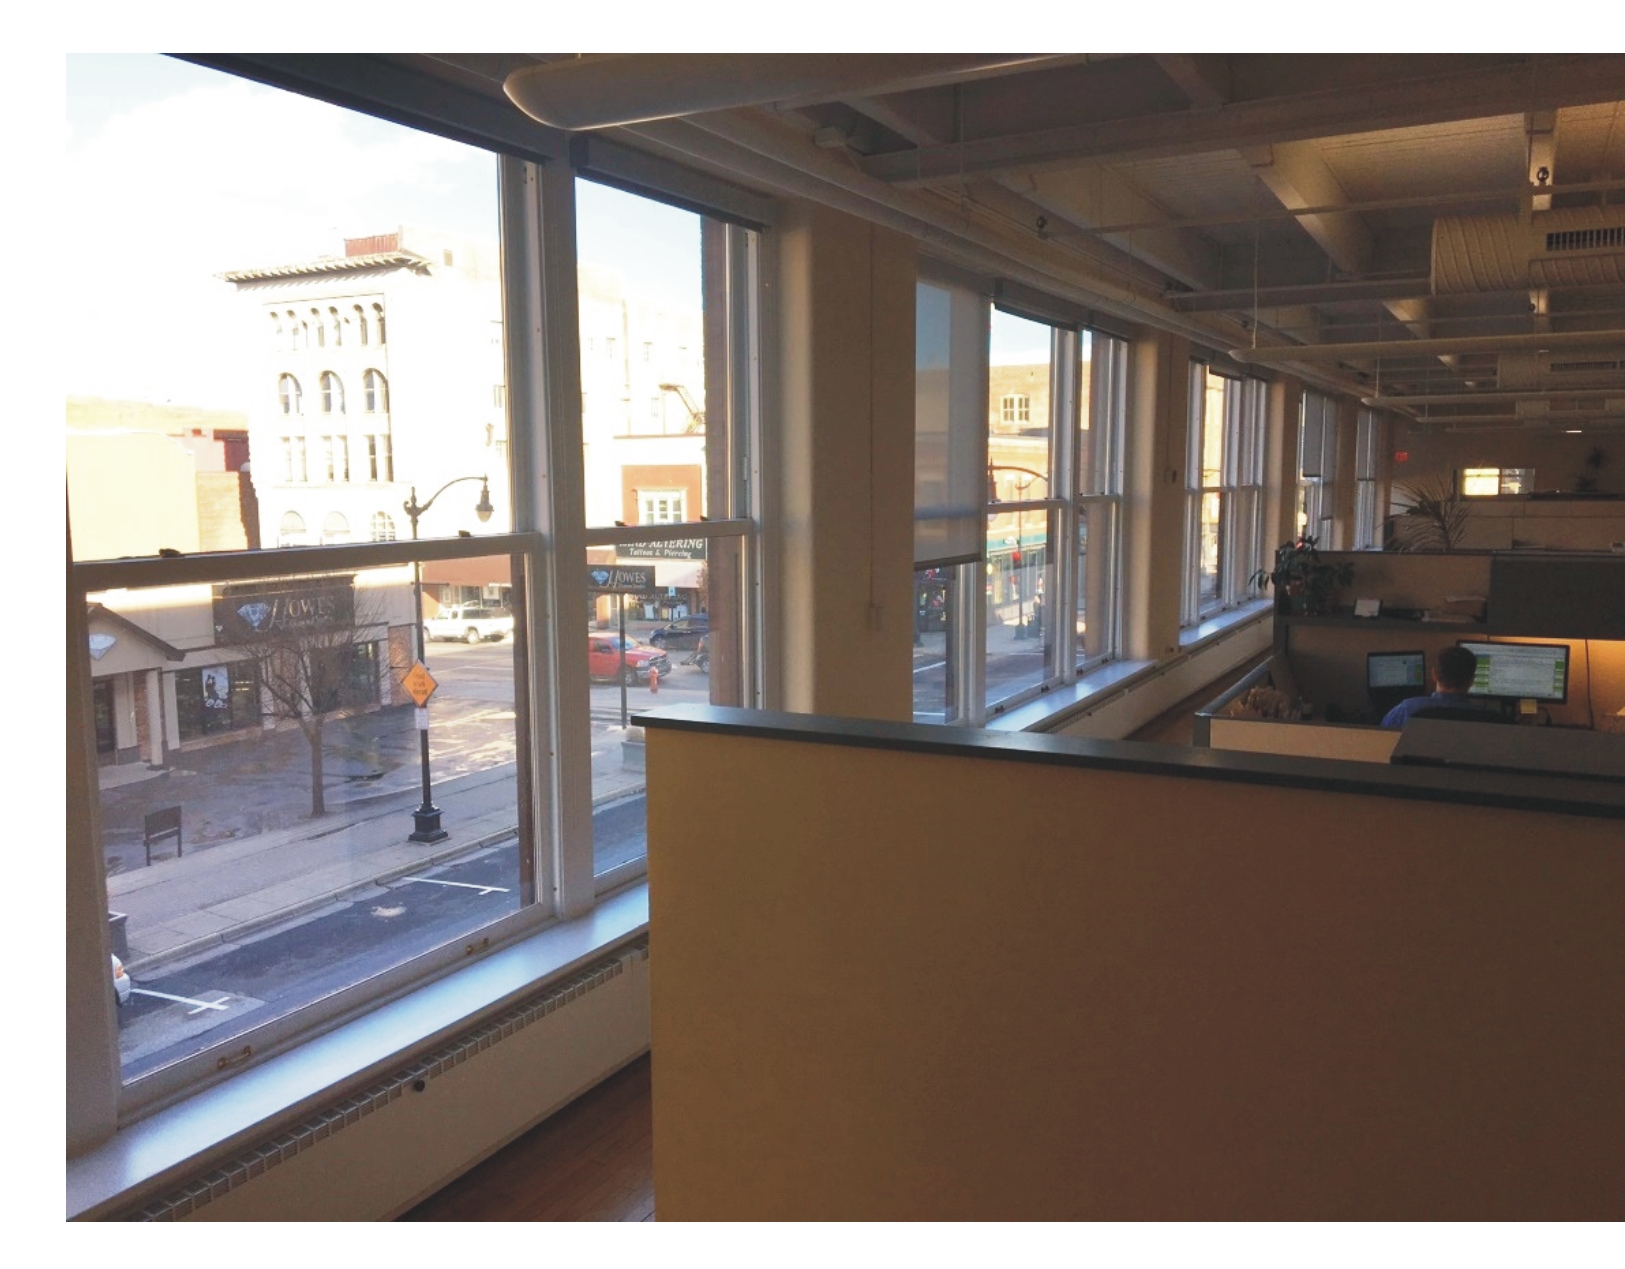
Most of these buildings are massive, meaning thick brick and mortar or poured concrete construction. Despite the hokey energy codes, massive buildings perform much better than stick-built, whether that is wood frame or steel frame. I’ve mentioned before that our office building has no insulation, super-thick walls, and enormous windows… and requires practically no heating energy.

Massive buildings help store a lot of the heat generated within. Data from our office building, when adjusted for climate (colder) would fit right in the middle of the NYC data. The heating requirement is very low, and therefore, the percent glazing is irrelevant. Finding heating savings would be a waste of time. There is nothing there.
Conclusions
Codes are crap. Savings against minimum code compliance are a farce. I become more convinced of this all the time because the data I see reinforces it over and over again.
As one of my favorite ACEEE studies Energy Codes for Ultra Low Energy Buildings says, we must investigate how buildings use and waste energy. These city-benchmarking studies are a great starting place.
[1] One thousand Btu, which incidentally no one understands.


Join the discussion One Comment