What is the purpose of the Clean Power Plan? To reduce emissions to 30% below 2005 levels by 2030?
No.
It has major flaws for actual, as in reducing tons of carbon dioxide release to the atmosphere, but I will come back to that later.
As reported in Clean Power Plan Coma Phase, the country is already half way to the CPP goal, and it hasn’t even taken hold yet. Instead, it has begun the decades long legal battles with an initial vote of confidence handed down by the Supreme Court.
How did we achieve 50% of the progress already? In order from high to low, per my guess:

- The base year, 2005, was the end of normal economic growth in this country. This was featured in two posts here and here, and is featured in the chart below in the blue arrow as a mirage of savings.
- Hydraulic fracturing has resulted in a flight to natural gas to overtake coal as the leading fuel for fossil fuel power plants. Natural gas has half the emissions per unit electricity produced compared to coal.
- A massive buildout of renewable energy since 2005. Wind turbine generation grew from 9 GW installed in 2005 to 74 GW in 2015.
- And of course, our beloved efficiency.
Net Wind-Power Emissions
Thinking, or assuming, that every kWh of wind and solar production displaces a kWh from a conventional carbon belching source is incorrect; and in some cases the opposite is occurring.
The intermittency of renewable sources requires a lot of flexible, responsive, conventional sources to fill in the troughs left by renewable sources – kind of like when I baked cookies as a kid. After getting my fill of cookie dough and the first batch out of the oven, my mom would typically finish the job.

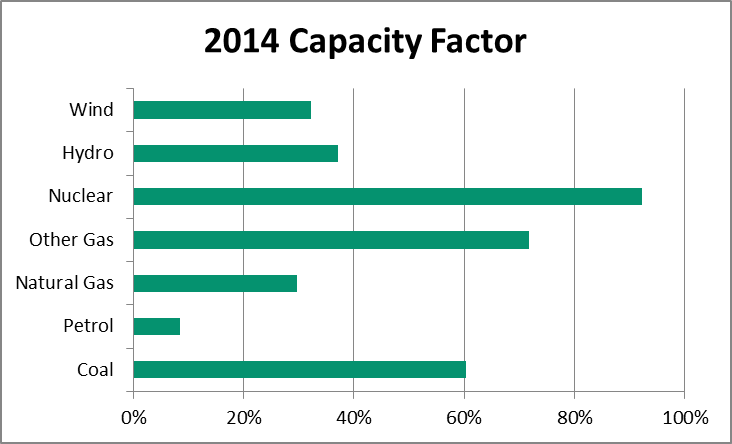
2014 Capacity Factor
The chart to the left shows the capacity factor for major sources of electricity nationwide.
Wind averages only 32% of its rated capacity over time. Coal actually seems to be serving more of a trim role to fill in the wind valleys, along with natural gas. Actually, Utility Dive just reported that natural gas power plant utilization overtook that of coal in 2015.
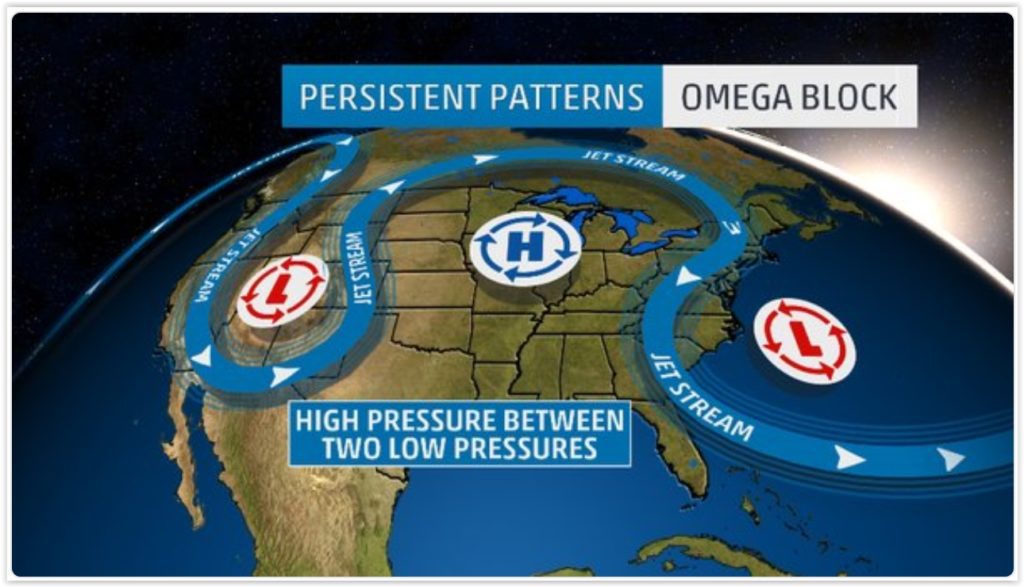
Omega High
Do you know what an omega high is? No, it is not related to cannabis. An omega high is a high pressure weather system that causes extended heat waves in the upper Midwest. Shown in the figure below, it can set up for days in the summer. The feature of this weather pattern is sunny, hot, humid and calm weather. Air rises in low pressure areas producing rain and storms. This also happens around the perimeter of the jet stream resulting in the so-called “ring of fire”, not to be confused with the Man in Black’s ring of fire.

In the middle is sinking air that compresses to add a few degrees of heat. Sinking air results in zero cloud cover.
No feasible energy storage solution is ever going to fill the gaping power hole left by the omega high. When power is needed the most, wind produces the least, and so we need a full fleet of conventional resources on standby to do the job.
The Punchline
I’ll get to the punchline first and then discuss some aftermath. As shown in the bar chart above, zero-emission nuclear power is nearly a constant, full-capacity source of carbon free power. Recent years have produced record capacity factors, approaching 95%.
Enter the 2.3 cent per kWh subsidy for wind power. Two cents is huge, and it is causing weird things around the country, like over-generation in the Northwest, California, and Texas. Because the marginal cost is essentially zero (no fuel), wind power is always sold first in auctions, like for Texas’ ERCOT. At times, they have so much wind production and insufficient demand that prices dip to negative, for the rest of the schlock generators. Negative means less than 2.3 cents in this case.
The same thing is happening in the Midwest. Power auctions for PJM, which is adjacent to a lot of wind resources, are leaving zero-emission nuclear plants in the red; $800 million in the red for one of Exelon’s plants in Illinois. This is not unusual, unfortunately.
Summarizing: zero-emission wind with a 2.3 cent subsidy in a 4 cent market is displacing zero-emission nuclear. Wind operates with a 30% capacity factor; nuclear, a 90% plus capacity factor. The difference is made up from conventional sources and increased emissions.
Even More Perverse?
According to this paper published by The American Bar Association, the flawed Clean Power Plan would “force states to move to fossil fuels”.
Uh-oh.
How is this? The CPP gives virtually no value to the emission-free nuclear power fleet. Virtually no value equals six percent, which was the percentage of nuclear slated for shutdown in 2012. The CPP gives no credit to keep nuclear operating when clearly a hell of a lot more than six percent is at risk of shutting down.
More perverse, the CPP incentivizes more, not less, emissions. A group of engineering students and their advisor from the University of Tennessee applied the CPP rules to states with nuclear power. The analysis showed that a total of 15 states would have lower official (not to be confused with real) emissions under the CPP if they completely shut down all nuclear and replaced it with combined cycle, carbon-emitting natural gas.
Progress.
