As readers of this blog are sure to know, electricity consumption growth has leveled out and essentially disappeared in recent years. This is celebrated, but I say, beware of what you wish for – kind of like winning the lottery. It may seem wonderful until reality and the unintended consequences set in. But I want to do a deeper dive into why energy consumption in buildings, in particular electricity, is on the fall.
As ACEEE reported back in February of this year, Why is Electricity Use No Longer Growing, efficiency is a significant contributing factor. I agree. But I also believe a perfect storm of sorts has contributed to the zero growth.
The ACEEE paper notes reasons for the zero growth from various sources including The Wall Street Journal, Public Utilities Fortnightly, and the Washington Post. These include appliance and lighting standards, erosion of manufacturing, building codes, and distributed generation. ACEEE notes essentially that, look (!) the economy has returned to pre-recession output and energy consumption is down! This is apparently true, per government statistics, but what no one has mentioned is building construction has been in the tank and is still in the tank. Building energy use is not likely to rise when the stock of buildings is flat.
Figure 1 below shows the historic number of new housing starts over my entire lifetime and then some. The gray regions are considered recessions. Clearly, despite the incredible, virtually negative mortgage rates imposed by The Federal Reserve, the new housing market is still in the tank. It’s on the same scale as the early 1980s when mortgage rates were in the upper teens.


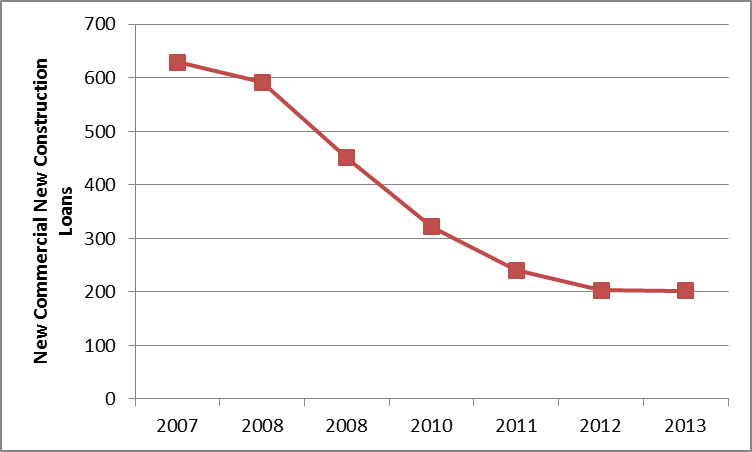
Data for commercial new construction is more difficult to find and quantify but one indicator is new construction loans. Loan data for commercial new construction starts are provided in Figure 2. Like residential new construction, commercial new construction is also flailing.
Lack of new construction will put a big squeeze on growing demand for energy – and it is. The only places these iconic construction cranes can be seen is where people spend other peoples’ money – state capitols and public universities. I was just in Iowa City and I could see several of these in the distance. In Madison, WI, they are a fixture. Ironically, when I Googled pictures of the Madison skyline, magically, there were none of these things. Photoshop.
Another big factor in energy consumption is the weather. There is a major correlation between energy consumption and average temperature – almost 30% from coolest to warmest. Data shown in Figure 3 are from 1991 through 2013.
Significant anomalies include:
- 2009 was a very cool summer
- 2011 and 2012 were very warm summers
- 2013 was close to average
Figure 4 above shows cumulative changes in electric consumption by sector and the change in gross domestic product since 1990. Combining the abyss of the recession with the cool summer of 2009 resulted in awful financials for electric utilities. You can see a general bump up in electrical consumption in the recent hot summers of 2011 and 2012 and then dropping back a bit in 2013. Yes, industrial energy consumption is heavily influenced by weather too.
Figure 5 above is the National Association of Purchasing Management’s index for manufacturing output. When the purchasing managers index is greater than 50, industry is expanding and when it is less than 50, industry is contracting. Clearly you can tell that over the past 23-plus years, industrial output has expanded – in calculus terms, the net area between the index above 50 is greater than the net area below 50. Over the same period, industrial electric consumption remains virtually flat, as shown in Figure 4.
The PMI is a simple survey of purchasing managers and whether they plan to expand or contract purchases. How much they plan to expand or contract is not included. It is impossible to extract the cumulative effect over time, precisely. However, we can simply add the differences between the index and fifty to demonstrate cumulative effects. It is better than nothing. This is shown in Figure 6 above.
Lastly, the economy over time has grown at an exponential rate – very smoothly and reliably – until the 2008-2009 recession. Figure 7 above says it all, in a nutshell. While ACEEE’s report declares that, look the economy is back to pre-recession levels and we are using less energy(!), it is not meaningful. The recovery has been very weak – again, note the absence of construction. By historic terms, the GDP is at least 12% below where it should be, as indicated in Figure 7.
In conclusion, the reasons for lost growth in electricity include:
- Very weak economy
- New home construction in the tank
- Commercial new construction in the tank
- Manufacturing efficiency over time
- Most recently, cool weather
- Saturation and market transformation of/to efficient lighting, televisions, computers, air conditioning, and refrigerators – a one-time shot
Add to these factors the foolish suggestion that the supply of natural gas is infinite, and we have a tough market for energy efficiency right now. The natural gas glut will be gobbled up in the next decade as giant petrochemical companies move production to the US and as transportation converts to this much cheaper energy source. This is not to mention the bottlenecks of natural gas distribution – a topic for another day.
If we can escape the self-inflicted poor economy (policy), which I have been ranting about since the inception of this blog (right where the GDP and curve fit in Figure 7diverge), demand for electricity will be on the rise again, natural gas prices will return to the norm and everything will be wonderful – demand for energy efficiency, included.


Join the discussion 3 Comments