If you enjoyed the greatest modern decade of sports, when MJ went six for six in the NBA finals, you would remember this McDonald’s commercial nearby. In it, Larry challenges Michael to a game of trick shots for Michael’s Big Mac and Fries. (I don’t know why my adolescent idol, MJ, would agree to play for something he already paid for, but…) As you can see, the game quickly progresses into an outlandish game of “first to miss, loses.” It leaves off with a shot from the top of Chicago’s fourth tallest building, the Hancock Tower.

Cost of Electricity
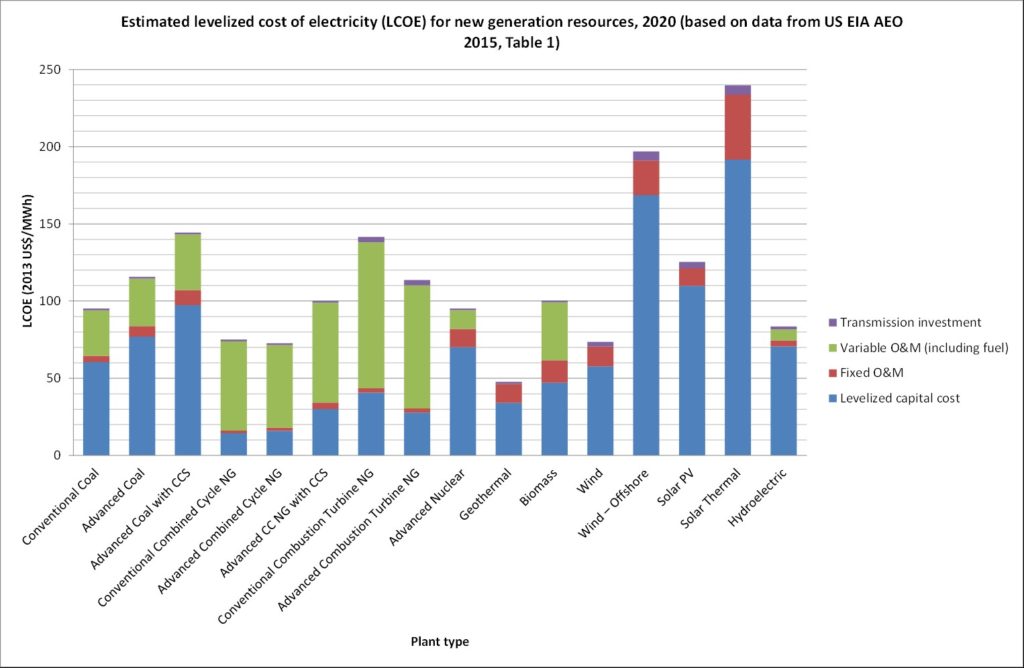
I searched for levelized cost of electricity generated from various power sources. The data shown are from the EIA, so it must be right, right? This chart was taken from a semi-recent blog, but it also corroborates with data from this Institute for Energy Research site, which shows a very similar chart.

I’ve read in many places that wind and solar have reached grid parity. Yeah. They’ve reached grid parity for producing kWh, but those kWh are like fresh vegetables grown in Minnesota. It’s inexpensive to produce, but if you live on vegetables, you need storage or imports, and you can’t can kWh like my mother canned beans, corn, soup, pears, apples, peas, cherries, pickles, ketchup, carrots, sauerkraut, beef, pork, and beets.
The value of a resource is like the value of a parent. Is the parent there and available all the time, or do they go away and leave the four and seven-year-olds to take care of themselves a few days when the weather isn’t right?
Wind energy doesn’t live by Moore’s law. It will get incrementally more cost-effective only through larger turbines and taller towers. Similarly, as silicon becomes a shrinking slice of PV cost, its prices too will reach a natural minimum.
Capacity Factors
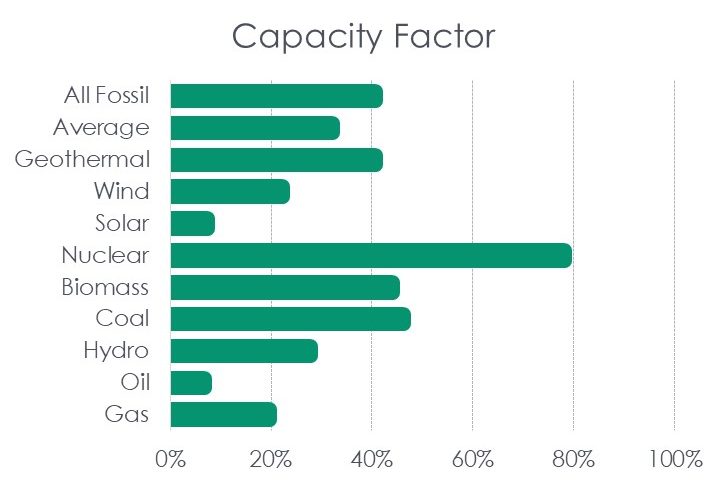
For another project, I recently analyzed capacity factors as reported by eGrid for utility-scale generating resources, nationwide. The capacity factor is simply the total energy (kWh) produced divided by what that asset could produce at full capacity at all times. Results are shown in the chart nearby.
Oil and gas capacity factors are low because a lot of their capacity is used for peaking, even though in Massachusetts, for example, the share of electricity produced is about two-thirds.

Produce is Like Energy Production
I just noted that people surviving on vegetables in the state of Minnesota would die without storage or imports, and that kWh can’t be stored as easily and cheaply as canned fruits and vegetables. Interestingly, the fruit and vegetable markets are similar to electricity in pricing.
For example, the price for local strawberries in the upper Midwest is the same, or even a little higher than those purchased from Watsonville, California, which are of course imported to the Midwest. How can this be? Are Midwest strawberry growers that pathetic? No. Like wind energy, we have one month of strawberry harvest in the Midwest. Meanwhile, we can get Watsonville strawberries almost year round. They are almost always available in the store. Watsonville strawberries are the nuclear power plant of the electric industry. They are cheap because they run at near full capacity, or at least can produce all the time.
Plenty of Fruit Left
Speaking of fruit, strawberries, and the dreaded “low-hanging” bromide, there is an enormous capacity available in dispatchable (demand response) and non-dispatchable (efficiency) resources. What about these resources, senator?
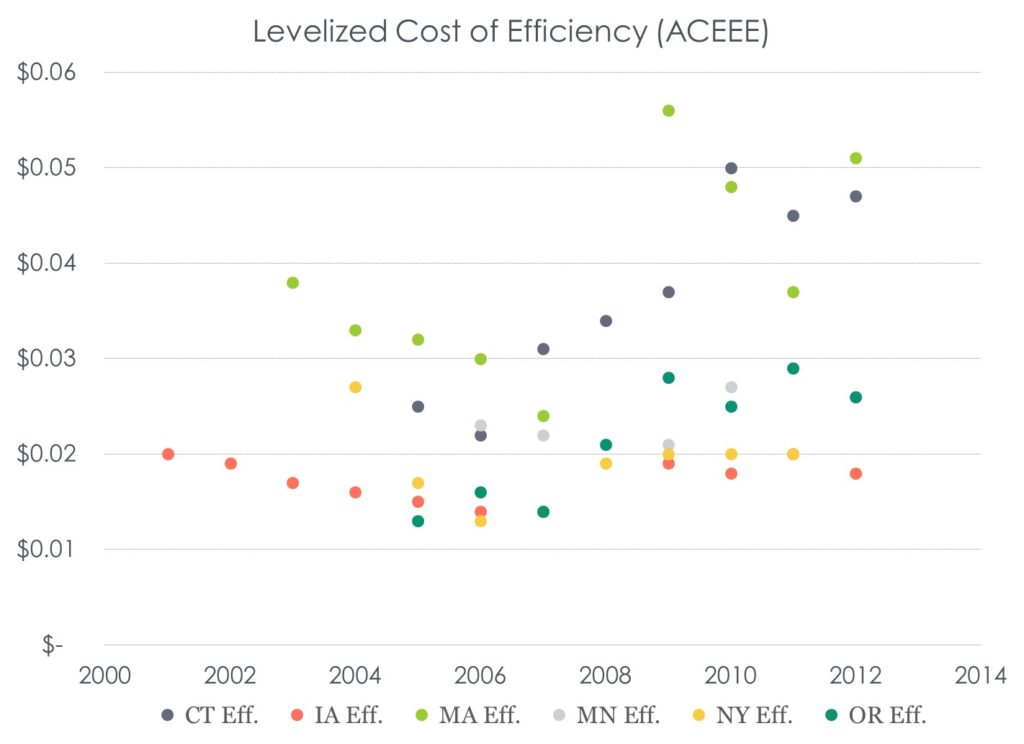
Remember the chart below from Drop it and Give me Twenty? The average cost of all those data, over all those years and across the entire continent, is 2.62 cents per kWh. Hmm. That’s interesting because the National Hydropower Association says it’s 2.5 cents. CleanEnergy.org assesses the Southeast’s cost of efficiency at less than two cents. Lazard estimates the cost of energy saved to be by far the cheapest resource, at 0.5 cents per kWh.

Efficiency, like renewable resources, is not a dispatchable resource. That is, you can’t order up 50 megawatts of efficiency for delivery tomorrow. However, unlike renewables, it is more predictable. When we invest in it, we know what we are going to get and when we are going to get it. Not so with wind and a lot of solar.
Load of Bricks and the Camel’s Back
Finally, consider the cost comparisons above and that the renewable resources produce power at those prices with irregularity. What’s not included is storage cost. If we were to go to all renewable, the cost doubles at least. Here in the Midwest, we don’t have canyons or gorges for hydro.
When are people going to get the fact that air conditioners, dryers, and dishwashers (and their equals in commercial and even more so, industrials) are NOT laptop computers and Apple watches? Moore’s law (PFFF!) does not apply to the vast majority of electric loads.
Renewables can take a substantially larger slice of the pie, but 100% is nuts. What about the cheapest and cleanest resource first? Efficiency and demand response!
I’m going to rant about the possibilities, specifically, in the coming weeks.
