This is the third and final post in a series of Energy Rants on rising electricity prices and unreliability. The first post, Rising Price of Less Reliable Electricity, defined and quantified the problem and discussed some reasons and challenges in the future. Last week in Electricity Rates and Reliability, I started with a state-by-state analysis of energy efficiency policy, electricity sources, and prices. My research for those two posts tipped off an avalanche of rich data to analyze. This week, I am polishing it off with a grand finale featuring state rankings for composite clean, reliable, and affordable electricity.
Electricity from Coal is Inexpensive
Yes, that heading is as pleasant as fingernails scraping and squealing across the chalkboard or watching what happens to cheaters in Martin Scorsese’s Casino, but I’m just a curious dude who likes data.
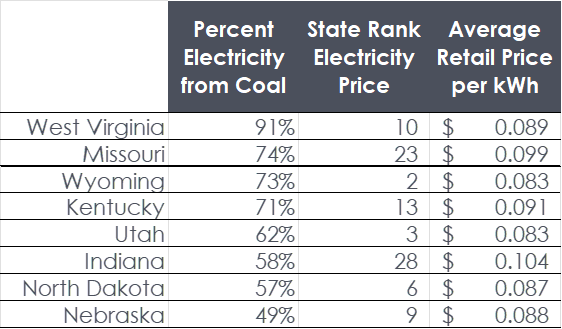
Only seven states get more than half of their electricity from coal[1]: Indiana, Kentucky, Missouri, North Dakota, Utah, West Virginia, and Wyoming. Their percentages and cost rank[2](cheapest ranks high) are provided in Table 1. I included Nebraska in the table since they are a whisker away from 50%.
Table 1 Coal States
 Conversely, the states that use zero or almost no coal (except for Michigan @ 32%) have the most expensive electricity[3]. Among those states, the ranking of carbon-free electricity is all over the map from #1 Vermont with 100% carbon-free to #48 Rhode Island with 9% carbon-free electricity.
Table 2 States with the Most Expensive Electricity
 Table 3 lists the top states for carbon-free electricity, ranked by percentage of renewable electricity.
Table 3 States with the Most Zero-Carbon Electricity
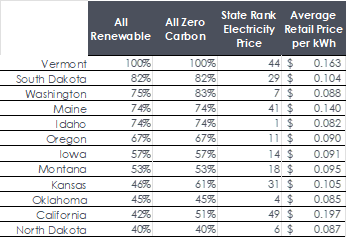 Electricity price and affordability are two different things. People pay their electricity bill’s bottom line and not the rates they are charged per kilowatt-hour and, in some cases, per kW of demand. However, most of the utility’s affordability control comes with the rates, but they can also assist customers with reducing consumption and demand. Affordability is also a factor in the median income in the utility service territory.
Reliability
The Citizens Utility Board of Illinois recently published Electric Utility Performance, rolling affordability, reliability, and environmental impact scores and rankings into one comprehensive report.
Reliability is tricky to measure as some utilities serve states hit by hurricanes, tornadoes, and ice storms. Nevada doesn’t have to deal with any of that and ranks number one in reliability.
There are three reliability metrics:
- System average interruption duration index = SAIDI
- System average interruption frequency index = SAIFI
- Customer average interruption duration index = CAIDI
The Institute of Electrical and Electronics Engineers (IEEE) has declared that the best measure of a utility’s reliability is the average number of minutes of outages per year per customer, SAIDI. SAIDI is the product of SAIFI and CAIDI – i.e., SAIFI multiplied by CAIDI. The CUB report notes, “Poor SAIDI scores can be driven by SAIFI or CAIDI, or both. For example, California and Michigan’s relatively high SAIDI scores are driven more by CAIDI (long outages) than by SAIFI (frequent outages). The reverse is true of Louisiana and Mississippi.”
If your brain isn’t throbbing and your eyes aren’t bulging yet, I can help with that. These metrics are factored with and without major event days, MEDs. Major event days result from ice storms, windstorms (tornadoes and derechos), wildfires, and hurricanes. Not counting outages due to these events is like the inflation rate without food and energy – but I get it.
As far as I can tell, extreme heat and cold do not qualify as MEDs. The CUB report implies that only about 1% of SAIDI is due to a “loss of electricity supply due to generation or transmission problems.”
Clean, Reliable, Affordable
Bringing it all together: clean, reliable, and affordable, I created Table 4 to rank states with the cleanest, most reliable, and affordable electricity by averaging their ranks of the three. I double dare readers to find this anywhere else on the planet. I added the ACEEE efficiency scorecard ranking for fun, but that is NOT part of the clean, reliable, affordable ranking.
Table 4 Composite Rankings – Clean, Reliable, Affordable
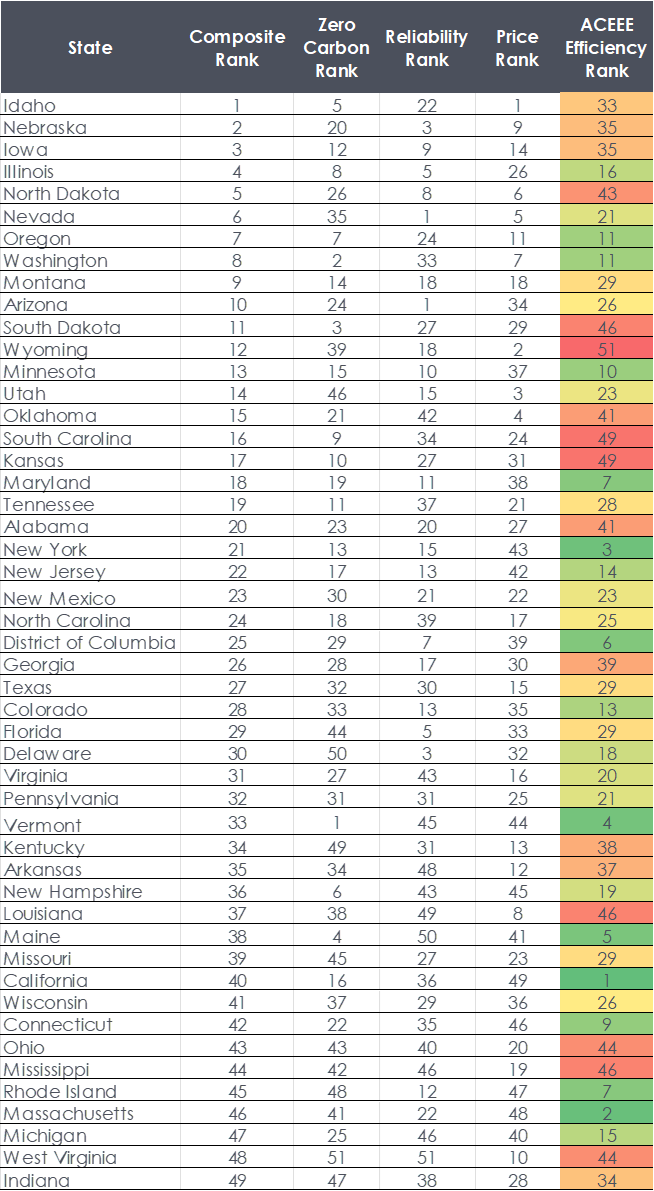 There are many interesting findings in the clean, reliable, and affordable rankings:
- Many Rust Belt and New England states rank poorly. Only Mississippi and California fall outside those geographics in the bottom ten states.
- Plains states, northwest, mountain, and sunbelt states (except California) rank well and dominate the top 15 spots. They use the resources available – some combination of hydro, wind, and even coal, to their advantage.
Energy efficiency can help to overcome some affordability issues. As noted above, price is only one factor of affordability. Two other factors include median incomes and the relative efficiency of buildings. For example, Kansas has a composite rank of 17 but is near dead last in energy efficiency. As we take what we have learned and achieved for a client (energy user) in a state with strong energy efficiency policies and apply it to the same client’s facilities in states with weak policies – it’s fish in a barrel, ducks on a pond, or can a corn.
So there it is: the best states for clean, reliable, and affordable power. Turn on the magnets!
[1] https://www.nei.org/resources/statistics/state-electricity-generation-fuel-shares
[2] https://www.eia.gov/electricity/sales_revenue_price/
[3] Alaska and Hawaii, which have the most expensive electricity, are not included in this analysis because they have obvious disadvantages because of their remoteness and/or sparse populations.
