I’m taking a detour off the industrial efficiency road this week to mention a few things about soaring electricity prices and what’s causing them. Like big oil, big tech is an easy target because trillions of dollars are involved, and who feels sorry for Elon Musk, Sam Altman, Jensen Huang, Zuck, Sundar Pichai, et al? The interesting thing is that, unlike many energy debates that skew heavily partisan, concerns about data center development cut across the aisle. A review of 142 advocacy groups pushing for more regulation shows a fairly even political split.
The Narrative: Data Centers Are Driving Prices
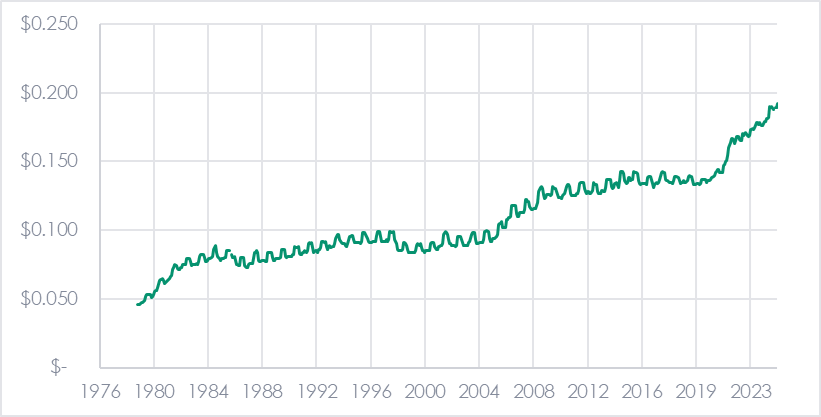
One of the driving forces behind the loathing for data centers is soaring electricity prices. While this is a common narrative, the data suggest it may not fully explain recent price trends. The Federal Reserve publishes average monthly electricity prices shown in Figure 1. Prices really exploded from January to October of 2022. Do you remember the howling over electricity prices back then? Me either, because burger prices doubled in the same period. This supports my earlier reporting that prices have soared since 2021, with the biggest jump occurring in 2022, as shown in Figure 1.
Figure 1 Average Nominal Monthly Electricity Price, United States
What the Data Actually Shows
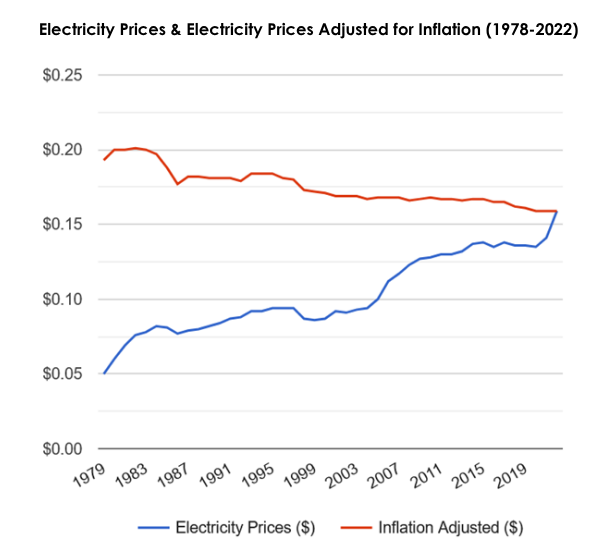
Over the long haul, electricity prices have decreased in real terms, meaning they have not risen as fast as general inflation, per USInflationCalculator.com. Even with the 2022 surge, we can see the price of electricity versus general inflation in Figure 2.
Figure 2 Inflation-Adjusted Electricity Prices, 2022 Dollars
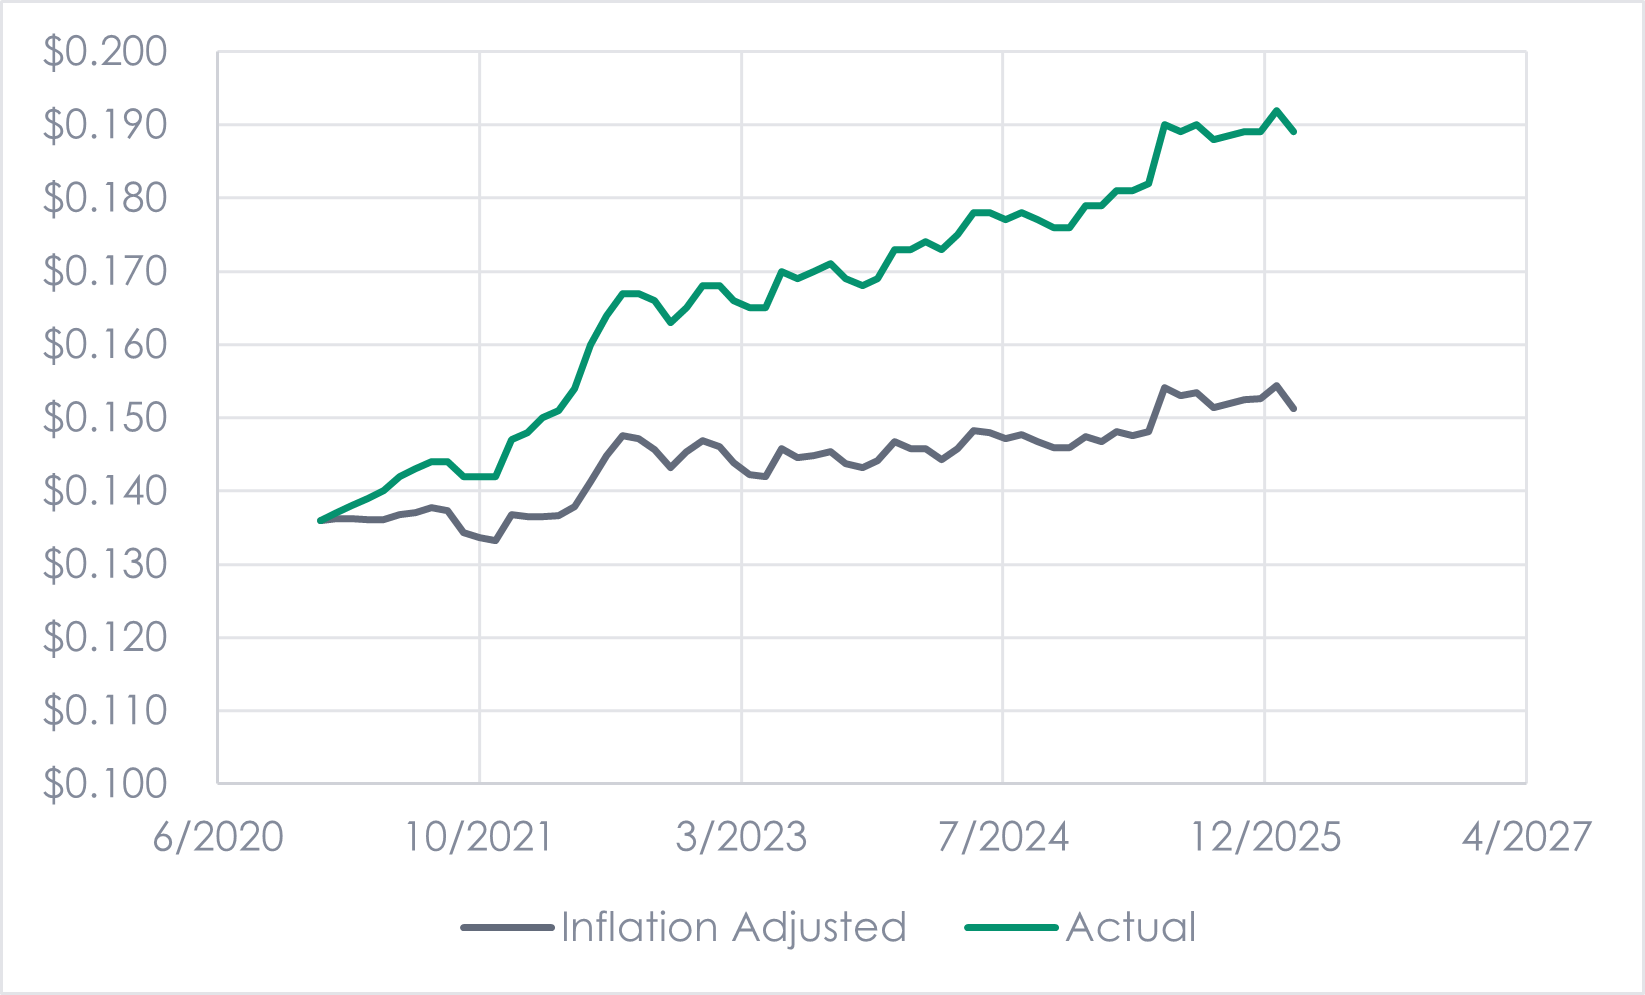
Since the data in Figure 2 are a bit stale, I manually grabbed the last five years and plotted the results in Figure 3. In real terms (inflation-adjusted), electricity prices rose 11% since the start of 2021. Nominally, electricity prices rose 39%. We can all see that electricity prices jumped much more sharply in 2022 than they have in the last two years. The difference: big, bad data centers weren’t surging in construction back in 2022. Now the boogeyman exists, and the torches and pitchforks want scalps.
Figure 3 Recent Electricity Prices v Inflation
Data Center Load Growth, Where?
Utility Dive reported that 50 GW of data centers are operating in the U.S. today. ‘For reference, Gemini tells us, “The estimated U.S. peak electricity load in 2025/2026 is approximately 760 GW to over 850 GW, driven by rapid demand growth from data centers and electrification.”
The Regional Price Contradiction
Utility Dive notes that data center expansion is growing fastest in the Midcontinent Independent System Operator (MISO) region, at a 43% compounded annual growth rate since 2020. 🤯 That’s 8.6X over six years! Coming in second through fourth are the Electric Reliability Council of Texas (ERCOT), the Southwest Power Pool (SPP), and the Southeast. For reference, see Figure 4 for these regions.
Figure 4 Regional Transmission Organization (RTO) Map
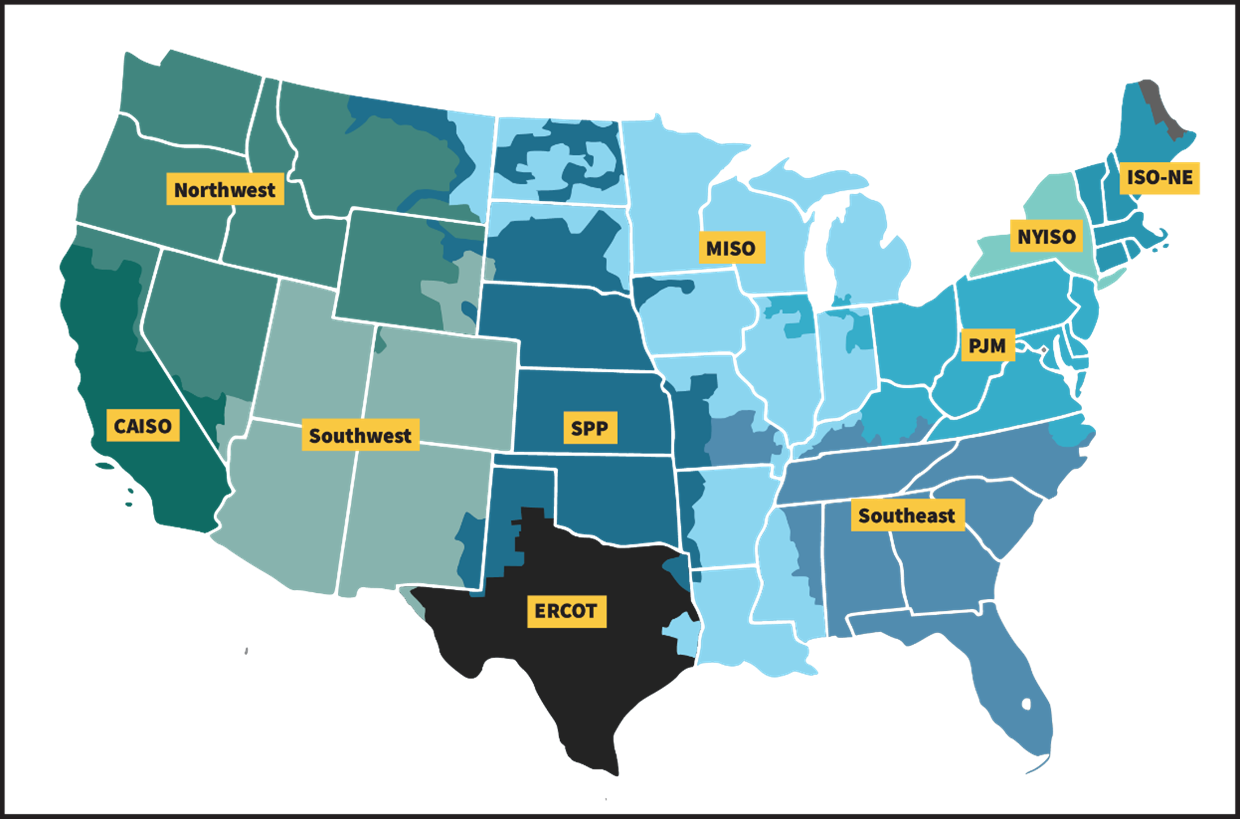
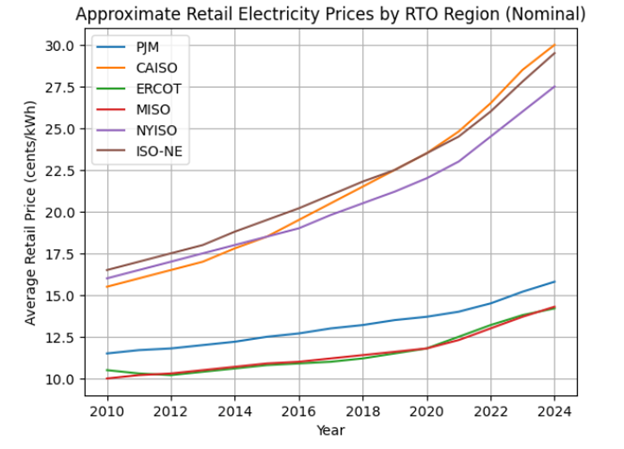
I thought, if data centers are driving up electricity prices, why are prices rising the fastest in the Northeast and California, where data center construction, recent past and future, is abysmal? In 2024, I pulled average retail electricity prices for each state and reposted them in Figure 5. Although there is no source for a summary of historical pricing by RTO, I pulled together the historical pricing by region (shown in Figure 6) to compare long-term trends. There you are – it’s hard to argue with Figure 6 based on Figure 5.
Figure 5 State Average Retail Pricing
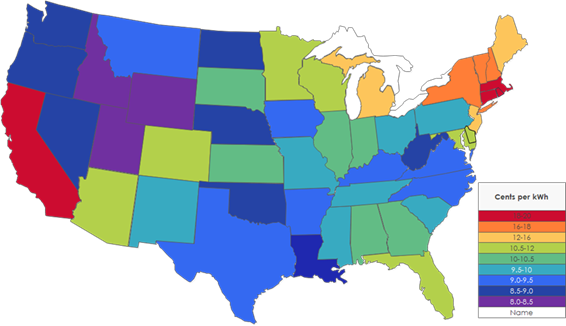
Figure 6 Historical RTO Retail Electricity Pricing Trends
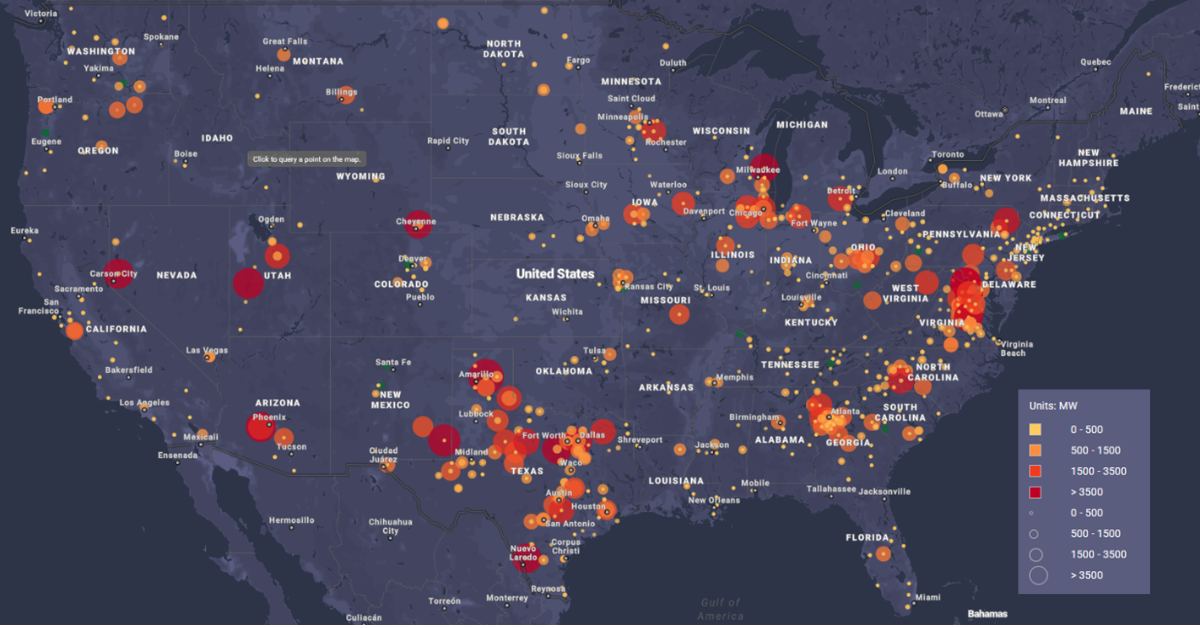
The National Laboratory of the Rockies, formerly known as the National Renewable Energy Laboratory, pulled together a groovy website that overlays data centers, their loads, transmission, fiber, natural gas pipelines, and more, into one site. Figure 7 shows operating data centers by county and electrical load, and Figure 8 shows operating and planned data centers. Despite having the greatest fiber-optic capacity, by far, New York is dead to data center developers. Why? A moratorium on natural gas expansion, which, of course, is causing electricity prices to skyrocket. Data centers? Nope.
Figure 7 Operating Data Center Load per County
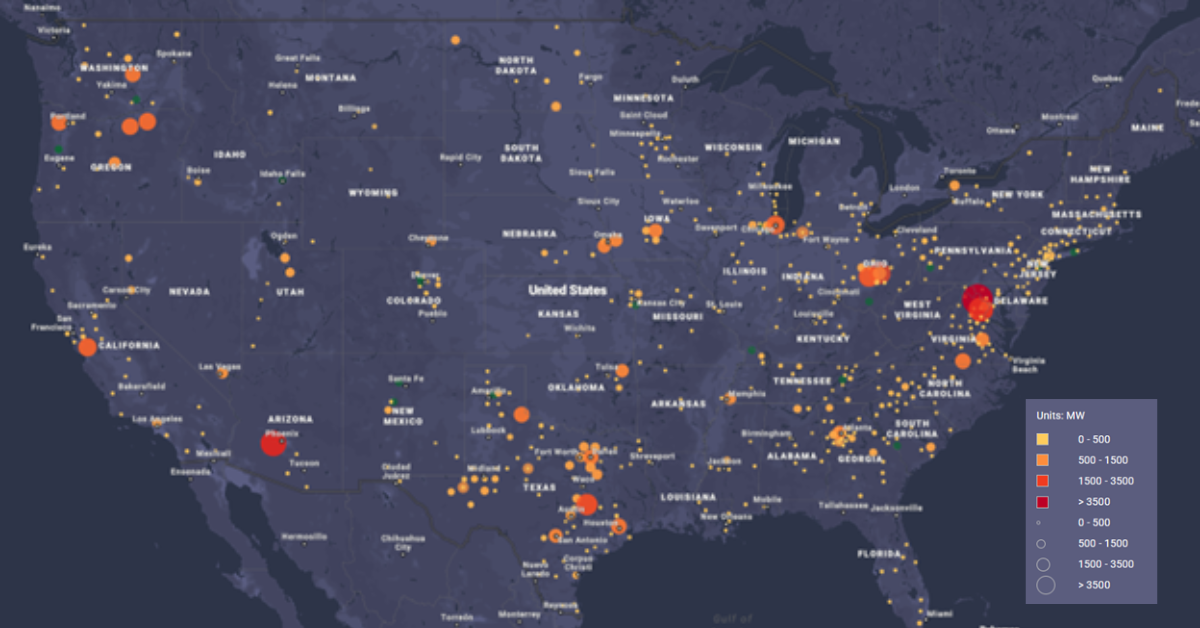
Figure 8 Planned and Operating Data Center Load per County
Peppy Le PUE (Get it?) Strikes!
Maine is in the process of voting in a moratorium on data center construction. That’s a skunk that thinks it doesn’t stink enough to keep more data centers away from the two tiny ones in the state today. “Maine has some of the country’s highest residential electricity prices,” The Wall Street Journal reports, but there are already no data centers in the state! Good grief!
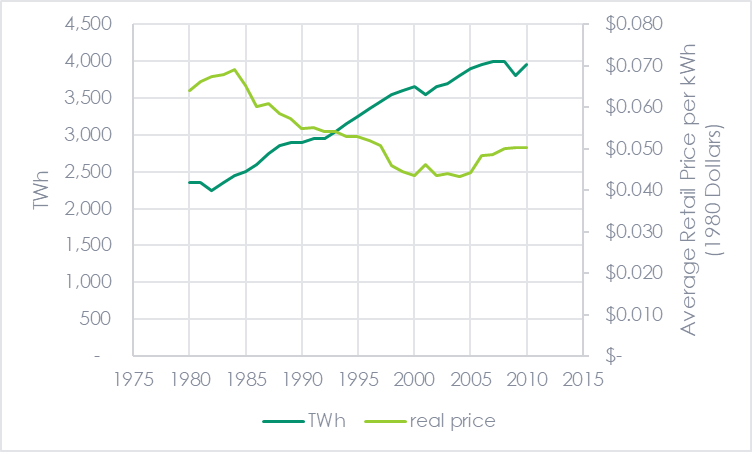
The last major point to demonstrate that data centers are not responsible for soaring rates is that, other than load growth, which had a 55-year run from 1950 to 2005 with a 4.59% compounded growth rate, resulting in an 11.8X multiple. Pricing data didn’t exist that far back, but over the 25 years from 1980 to 2005, consumption doubled while the real price of electricity fell by 21.5%. CLEARLY, historic load growth does not result in soaring prices.
Figure 9 Electricity Sales Growth and Price
Maximizing Value with Higher Load Factor
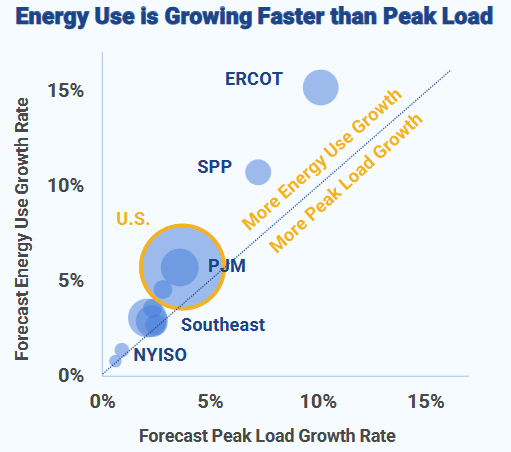
My last point is that data centers have a high load factor, which means they increase electricity sales relative to peak load. Feast your eyes on Figure 10, which, as basic economics would suggest, tends to put downward pressure on prices. It shows that for a MW or GW of supply (generation, transmission, distribution, substation), we’re getting more sales. More revenue per hunk of iron reduces prices, all else equal.
Figure 10 Electricity Sales vs. Load Growth
The problem is, not all else is equal. What’s different than the 25 years ending in 2005 is terrible policy, at least for electricity pricing, and deregulation. Those are subjects for another day.