
It’s about time I got back to my stack of research reports, and I have a good one this week to write about: Distributed Generation: Cleaner, Cheaper, Stronger, by the Pew Charitable Trusts, October 2015.
First off, let’s compare brilliant efficiency versus sexy renewable supply resources. I think it may have been Bill LeBlanc of E Source who suggested instead of cash rewards for efficiency, we give customers faux solar panels to put on their roofs. People understand renewable supply while they have some combination of not understanding or trusting efficiency; nor do blower door test results make for great cocktail party talk. [1]
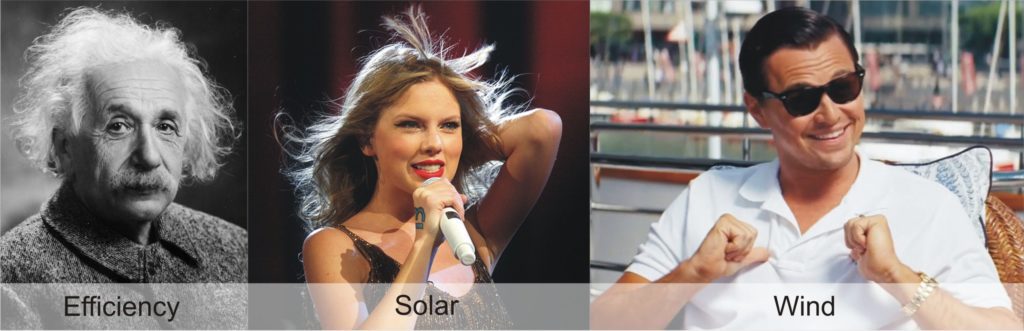
But since people, and unfortunately congress, understand sexy renewables and not the theory of relativity, we have massive bipartisan federal tax subsidies for wind and solar. The production tax credit for wind generation is 2.3 cents per kWh, and the investment tax credit for solar is 30% of installation cost; i.e., a 30% discount, from the rest of us who pay taxes. What does efficiency get? 0.00 cents per kWh.
Since subsidies have been in place, the cost of wind generation has been halved, and the cost of solar has dropped 75%. This has resulted in some absurdities. For example, in Texas, wind capacity is already so high at times that utilities are giving electricity away for free. The training-wheel handouts are no longer required.
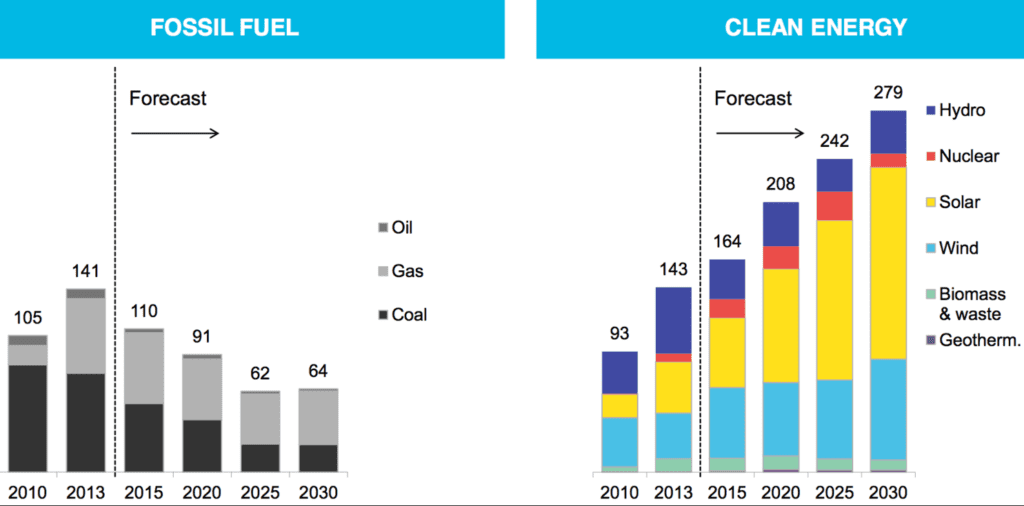
According to Bloomberg, renewable energy capacity additions have surpassed that of coal, natural gas, and oil, combined (chart below). Isn’t there something wrong with the subsidy and market math here? The dirty secret is that the beneficiaries of this largess are the wealthiest American’s.
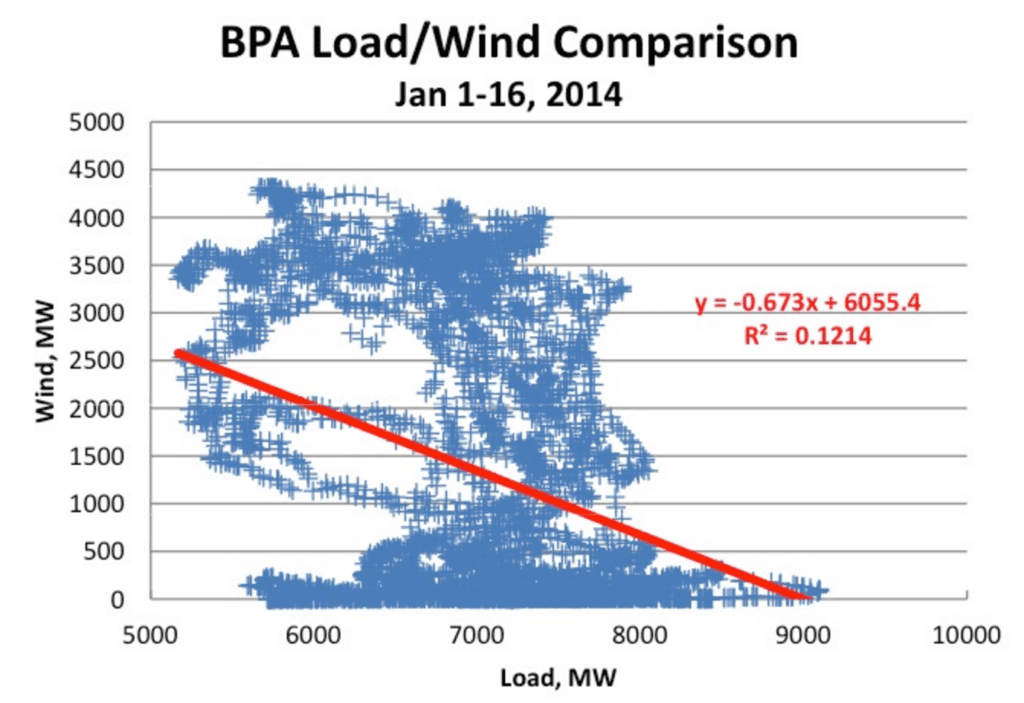
This article from Forbes shows how crazy the buildout of highly irregular/intermittent wind resources is driving grid operators in the Northwest over the edge. In a nutshell, there is so much wind capacity in the Northwest that they simply switch back and forth from zero carbon sources of hydro and wind, depending on how the wind blows. Please direct your eyes to the following graphic for wind power availability versus demand, from the Forbes article. Power generated, as shown, is from 4,200 MW of installed wind-turbine capacity. It ramps from 100% output to zero when it is needed most.
Alrighty. Back to the Pew report, with these issues as a background.
The Pew report opens with a number of true/accurate statements (for that matter, it’s probably all true and accurate).
- Our century old centralized system is yielding to advanced, distributed-energy generation capabilities where more power is produced closer to the point of use.
- Flat demand growth and changing expectations are driving the nation toward cleaner, cheaper, decentralized power sources.
- These new technologies pose significant challenges to long-standing regulatory models.
- Reluctant utility players could slow progress [my emphasis] and delay the transformation.
- The national interest will be best served if utilities take an active role.
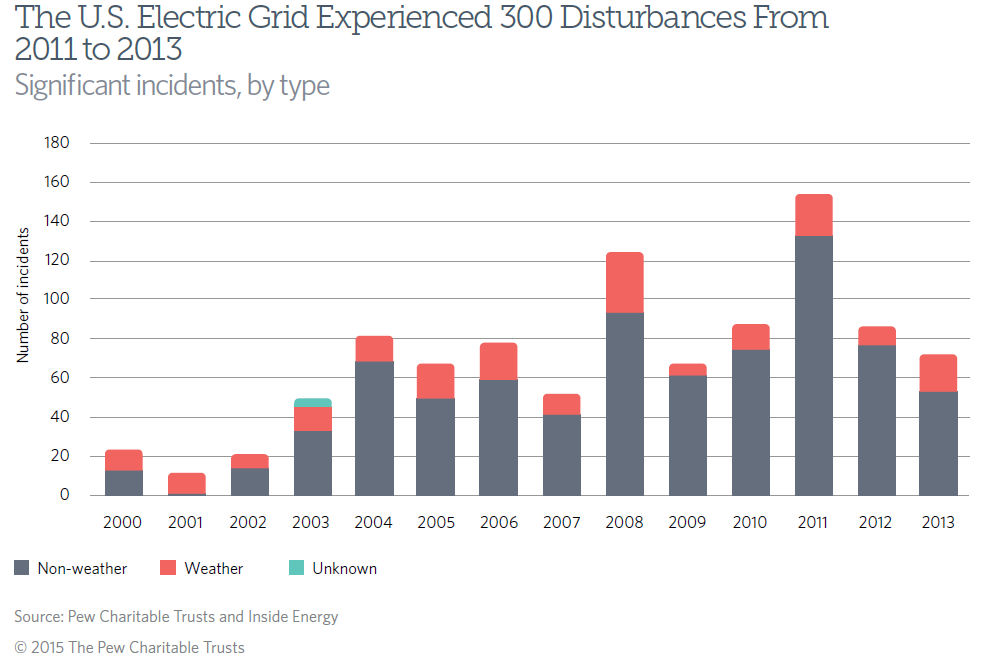
Here is what I found to be amazing from the Pew report: the U.S. experiences more outages than any other developed nation (to be fair we are probably the largest developed nation). But more importantly, from 2000 to 2014, outages have increased six fold – 600%! Is this due to weather-related events or climate change? No, as the following chart from the Pew report shows.
I am not a grid expert, but adding large doses of highly intermittent, and to a large extent, uncontrollable sources and shutting down reliable centralized plants in meat-cleaver fashion, we are willingly pushing the grid to its limits. The results are not pretty and it won’t be getting better.
The explosive growth of renewable sources, favored by heavy tax subsidies, is credited for jobs and a robust industry. But consider this: the Pew report quietly notes that outages cost business $150 billion annually. That’s pretty amazing considering 2015 electric sales to commercial and industrial customers totaled $209 billion dollars! Whoa! This gives new meaning to non-energy benefits.
Policy driven by an under-informed public, exacerbated by the short-sighted political class is steamrolling us toward a more fragile, vulnerable, intermittent, less certain, less resilient, more expensive power supply – with orders of magnitude more complex and points to control to keep the lights on.
Did I mention who will get the blame when the power goes off? The utilities and grid operators who need to manage this three ring circus of cats – that’s who.
Einstein
Meanwhile, the homely, poorly understood demand side resources, which mitigate and flatten loads – the world in which we all live – get free access to the dumpster, only. No silver platters here. Nearly all demand-side programs mitigate, and certainly do not exacerbate, spikiness and associated instability of power supply and availability. Even retro-commissioning, which is largely considered to be an energy-reducing program, can and does have a real impact on flattening load curves. For that matter, the typical, non-rural load profile for an RTO shows the grid peaking between 5:00 PM and 7:00 PM. For examples, see ERCOT (Texas), PJM, ISO New England, and of course, California. Why do customers get charged for setting peaks anytime between 9:00 and 9:00? Rate reform, anyone?
[1] Photo Sources: Albert Einstein – https://en.wikipedia.org/wiki/Albert_Einstein; Taylor Swift – https://en.wikipedia.org/wiki/Taylor_Swift; Leonardo DiCaprio – http://www.thefashionisto.com/ray-ban-celebrity-movie-pictures/leonardo-dicaprio-jordan-belfort-the-wolf-of-wall-street-rayban-wayfarer-sunglasses-celebrity-picture/
