A year ago, I opened one Rant with Smart meter. Smart meter. Smart meter. Smart meter. Smart grid. Smart grid. Smart grid. Smart grid. I hereby open this post with Big Data. Big Data. Big Data. Big Data.
Big hype.
Big whoop.
The Association for Energy Services Professionals held an online conference last week, and the theme was…. Big Data. Like smart grid and smart meters, big data presents an enormous opportunity for energy efficiency, the evolving energy infrastructure, and utilities in general. Like smart grid and smart meters, the Pacific Ocean lies between where we are and the new world.
Big Data Precision
One time, we had a client who seemed to like precision described to him in terms of precisions of various weaponry. For example, “Is that hand-grenade close or shotgun close, or just an A-bomb SWAG?” This was a guy from the grocery industry. I have not crossed paths with anyone asking for a 90/Peacemaker sampling design for an impact evaluation yet.
I would say the state of big data is cruise missile precise. Translated for commercial buildings, it provides a great opportunity to comb through building stock in a given jurisdiction (city, county, utility territory) to find the facilities with high probability of substantial savings potential; i.e., 10% or greater.
Big Data Chaff
One of the statements made during the AESP online conference that made me scoff was, “There is no correlation between building energy intensity and savings potential.” That is like saying there is no correlation between body weight and sprinter speed for the entire population of homo sapiens. World class sprinters are probably in the 200 pound range. The 5’ 3” ninth grader, a pleasantly plump 32 year old engineer[1], or even the fit sixty year old probably can’t throw a baseball as fast as Usain Bolt can run. (Is that a name of destiny or what?)
The “no correlation” claim is a ruse for the unsuspecting audience participant. Of course, building type and usage characteristics must be factored into the equation, like human age, percent body fat, gender, and fitness status must be factored into estimations of sprinting capability. Even those who have never heard of the Olympics would suspect there is a correlation between body shape, age, and speed.
Big Data 2.0
I can make up nerdy me-too terms as well; well, maybe not as well as anyone, but like anyone else.
A cruise missile makes a mess, but like other weapons and virtual audit tools, it presents a vital function with purpose in the cost effective pursuit of enemy destruction[2]. When the time comes to zero in to precise energy efficiency measures, another realm of big data is there for the harvest. Its analysis is quite necessary, in fact.
Sure, it may be easy to spot opportunities for tightening schedules with a cruise missile, but as I described back in February (Energy Analytics; A Loaded Weapon), the practitioner better investigate the reasons (which number from one to 45,000) for the long operating hours; lest the savings disappear faster than a Packer lead in an NFC Championship Game. I.e. the savings will be undone before the engineer parks the car in the garage that night.
Besides, tightening schedules typically has low impact on dollar and demand savings because savings accrue off-peak, or at least off-peak from the perspective of the building’s load profile, which dictates demand charges.
The Good Stuff
The good stuff, or bad stuff, depending on the perspective, bleeds away throughout the day, week, season, and year. Major opportunities include simultaneous heating and cooling, ventilation control, variable speed control, and more nuanced, but major waste sources I won’t get into. To burrow in, find, and solve these issues with persistence requires tackling Big Data 2.0.
Building control systems have hundreds, thousands, or tens of thousands of control points, system inputs and outputs. Among these thousands of points and readings are likely dozens of deficiencies and faults – stuff that isn’t working. These thousands of points are generating data constantly, but they are typically dumped with a very short, if any, shelf life.
The fastest way to capture these data is plugging into the building’s energy management system with proprietary software. Control systems all advertise great data collection capability, but in reality, from what I gather from our engineers, it’s lousy, clunky, and not practical to cost-effectively use.
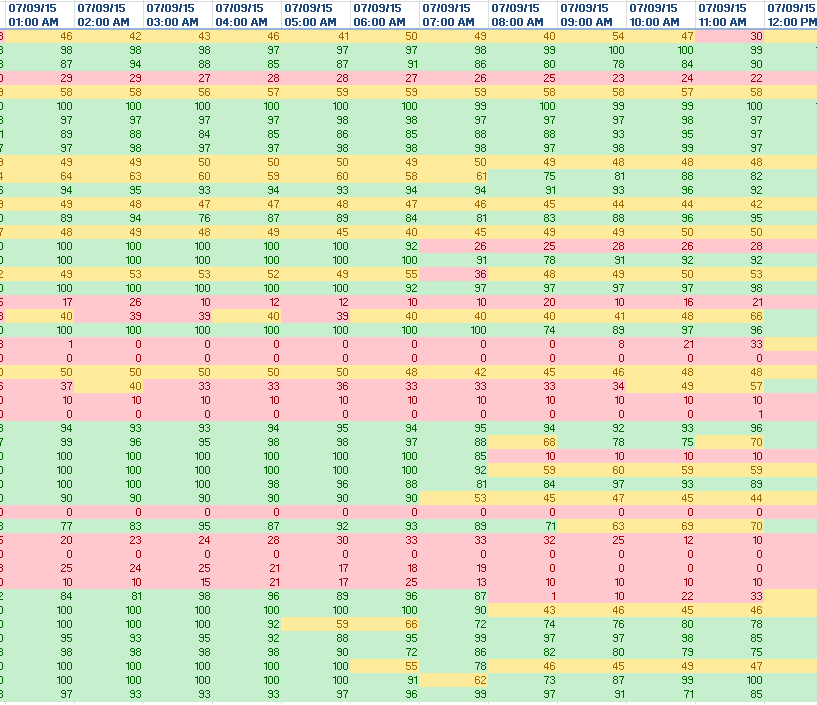
We are developing data visualization tools to take these millions of data points to paint a picture that our engineers can read like doctors read CT scans and MRIs. A sample of its current state of development is shown in the table to the left.
Each row represents a given temperature control zone (room). It is used to identify problems with zone control valves, dampers, and space temperature control. Red represents problem areas; green is good; orange in between.
If these problem areas are not addressed, the good stuff cannot be harvested.
[1] As a class, engineers have about the same protections as skunks, house flies, mice, and tax collectors; and no, I don’t know of any 32 year old engineers.
[2] As a class, engineers have about the same protections as skunks, house flies, mice, and tax collectors; and no, I don’t know of any 32 year old engineers.

