Skip to main content
search
Menu
About
Why We’re Here
Team
Careers
Diversity, Equity, and Inclusion
Solutions
Utility Programs
Research and Evaluation
Thermal Energy Consulting
Commercial and Industrial
Customer Support Center
Resources
Energy Rant
The Big Why of Evaluation
The Hopper
Case Studies
New Briefs
Papers and Presentations
Contact Us
Request Proposal
search
Close Search
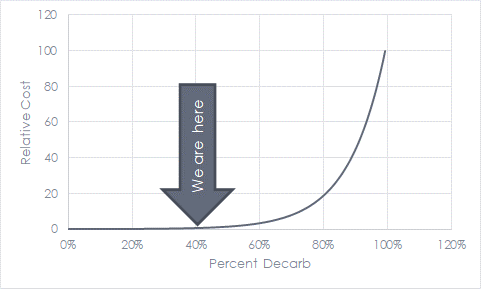
Figure 3: Cost versus Percent Decarb
Leave a Reply
Cancel Reply
My comment is..
Name
*
Email
*
Website
Save my name, email, and website in this browser for the next time I comment.
Δ
Close Menu
About
Why We’re Here
Team
Careers
Diversity, Equity, and Inclusion
Solutions
Utility Programs
Research and Evaluation
Thermal Energy Consulting
Commercial and Industrial
Customer Support Center
Resources
Energy Rant
The Big Why of Evaluation
The Hopper
Case Studies
New Briefs
Papers and Presentations
Contact Us
Request Proposal