
As Fall sets in and I debate when to turn on the heat (pump), I think about other ways to efficiently keep homes warm. In addition to upgrading the  efficiency of the heating equipment, improving a home’s building envelope (insulation and air sealing) is a great way to reduce energy use.[1] The EPA estimates that US homes can save an average of 15% of their heating and cooling energy use by improving the air sealing. Individual houses can have higher levels of air leakage than others, but there is no way of knowing how leaky a house is and whether it is prudent to do comprehensive air sealing without going onsite and conducting a blower door test, which costs time and money. What if we could identify homes that were more likely to be leaky and have higher savings potential? Let’s explore some recent data!
Measuring Air Infiltration
Home energy professionals measure the leakiness of homes using a blower door test, which depressurizes a home and then measures the rate of air coming back in through gaps in the building envelope (air infiltration). Blower door tests often measure the building’s airtightness in terms of CFM50 or the airflow in Cubic Feet per Minute that occurs with a pressure difference of 50 Pascals. The higher the number, the leakier the house. According to The Energy Conservatory, a manufacturer of blower door testing equipment:
“An old and uninsulated, two-story, wood framed house would likely produce a CFM50 test result between 4,000 and 8,000, which is very leaky. A new modern house built to a strict airtightness standard would likely produce a test result between 600 and 1,000 CFM50, which is very tight (in this instance, mechanical ventilation would probably be needed to keep the home’s air quality good).”
Every 10 points in the CFM50 rating is about one square inch of an air leak. Using the above examples, a home with a CFM50 of 4,000 would have air leaks equivalent to a hole about 2.8 square feet in size or about 4.5 sheets of 8×11 paper.
Another metric used to measure air infiltration is ACH50 or Air Changes per Hour at 50 Pascals. ACH50 incorporates the volume of the home. Generally speaking, due to the square-cube law, larger homes will have a greater volume per unit of surface area than smaller homes.[2] This means that there is less air infiltration per square foot and changing the air in a larger home requires moving more air, reducing the comparability of homes of very different sizes. Because of this, many organizations focus on CFM50 per square foot as the preferred metric, although energy code uses ACH50.
To help utilities understand the potential for energy savings from air infiltration, Michaels Energy has completed blower door tests as part of several recent baseline and potential studies. In the course of doing so, we hypothesized that programs may be able to use commonly available characteristics of a home to predict its leakiness (i.e., its potential for savings from air sealing measures).
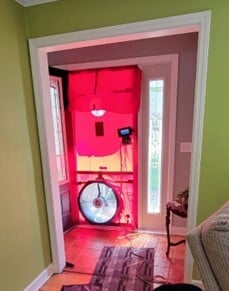
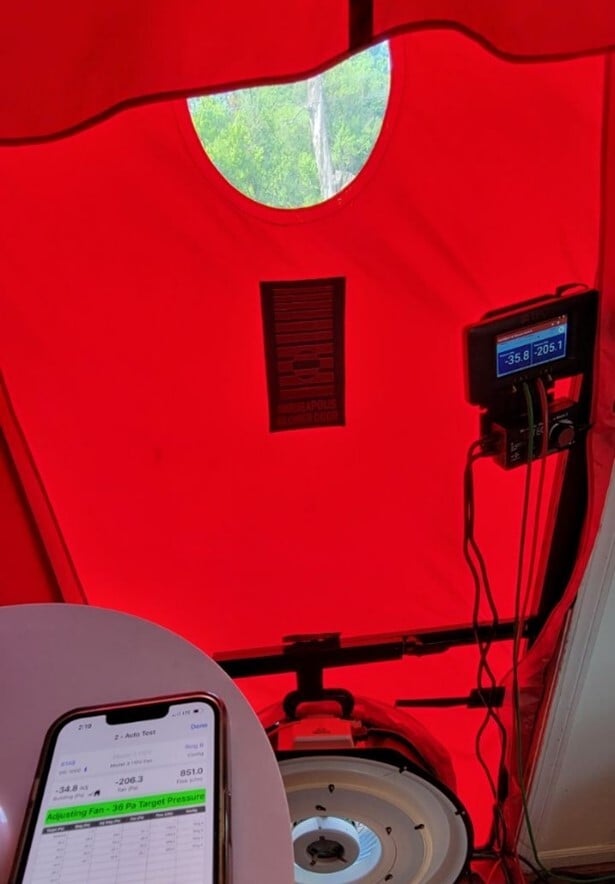
Some pictures of blower door tests completed by Michaels Energy’s engineers
What We Found
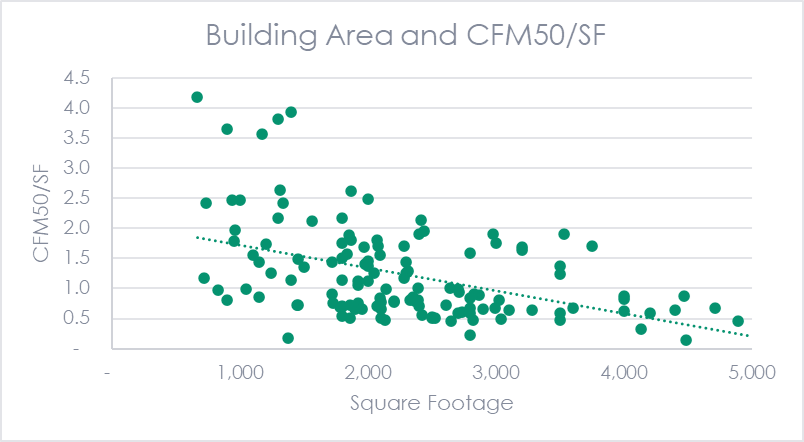
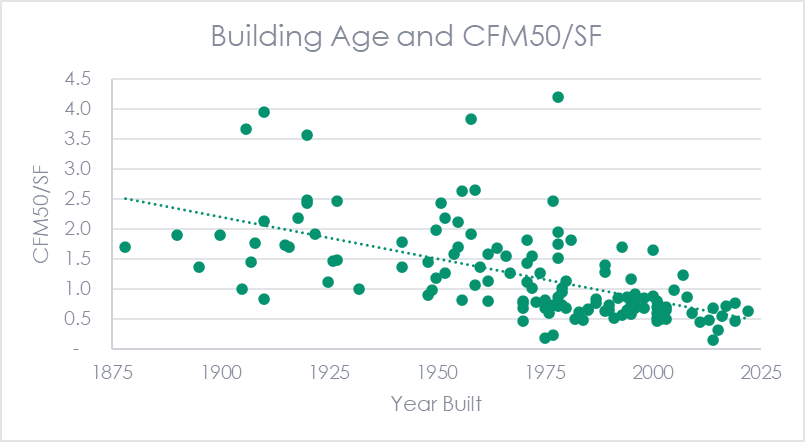
The figures below show the results from 131 blower door tests Michaels recently conducted compared to its building area and age. Generally speaking, we found that the airtightness of homes increased with its building area and decreased with its age. This makes sense because newer homes are subject to modern building codes as well as more stringent energy codes and newer buildings tend to be larger.
For one study, Michaels ran regressions to assess the correlation between ACH50 and the building characteristics collected during onsite visits for a baseline study. These included: building square footage, age, number of stories, numbers of windows, number of total window panes, framing type, general air sealing condition, basement square footage, unfinished basement square footage, basement type (i.e. finished/unfinished/none), CFM50, average daily kWh consumption and household income.
Based on this analysis, we found that ACH50 decreased with square footage, increased with the age of home, and increased based on the presence of a finished basement. Including these variables resulted in the best performing statistical model. We also found that the home’s daily electric usage was correlated to ACH50 as a home would likely use more energy to keep a leaky house comfortable. Presumably, this would also hold true for natural gas usage, but it was not available for this analysis. Unfortunately, a home’s utility data may not be readily available, limiting the usefulness of this variable.
Next Steps
This quick exercise provides an example about how we can creatively use limited primary data to develop cost-effective solutions to programs’ needs. In this case, we can use information from relatively costly site visits to understand the common characteristics of homes with high air infiltration. Programs can use this information to not only better target homes for air sealing measures, but to more accurately estimate the potential savings of the homes and the utility’s broader building stock.
[1] It is recommended to address your home’s building envelope issues first before upgrading heating and cooling equipment so that you reduce your home’s heating/cooling load and buy a smaller sized system.
[2] This is also why squirrels can jump relatively higher than humans.