Back in the day, when I interviewed engineers for potential employment, I would ask what they’ve done in their lives to study and reduce energy consumption. As an example, this week, I nerded out on tires. As an efficiency nut and passionate driver of our curvy paved roads through beautiful Western Wisconsin, I have a thing for tires. They must have decent handling in snow, low rolling resistance for efficiency, and preferably ride like rails.
My foray began with an article from Wired.com titled “The Race to Create the Perfect EV Tire.” That article propelled me into numerous rabbit holes, and I will cover them all this week and next. This week, I will cover the basics. Next week, I’ll explore automobile-related factors, including electric vehicles.
Rolling Resistance Introduction
Tires have viscoelastic properties, which is a sexy way of saying they deform as they roll over the road. If they didn’t deform, they would be like steel wheels. How much traction can you get with a steel wheel on concrete, asphalt, or gravel? Not much because hard materials like steel don’t deform, so the contact surface with the road or rail is minimal. This is great for efficiency, which is primarily why shipping by rail is quite efficient, but it is terrible for road safety and provides a loud, rough ride.
Rolling resistance accounts for 20-25% of an automobile’s energy loss or required power/energy – whoa! The rolling resistance force is relatively constant over typical speeds, while the drag force, aka wind resistance, increases exponentially with speed. As we shall see, rolling resistance varies with tire temperature, pressure, and tread wear.
Rolling Resistance Physics
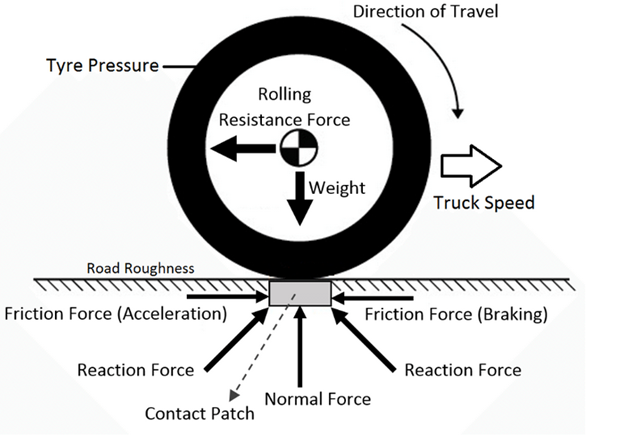
Engineering nerds probably solved a dozen problems in sophomore physics or dynamics classes using a diagram like the one in Figure 1. I do not remember rolling resistance, but we calculated static and dynamic skid forces. I.e., we calculated how fast a car may have been going at a crash scene by measuring the length of the skid marks. That’s called forensic engineering. The calculation for rolling resistance is similar; only the unitless coefficients are different.
Figure 1 Wheel Force Vector Diagram[1]
 Since the rolling resistance force is small compared to the normal force (the weight carried by the wheel, say 750 pounds as one of the four wheels carrying a 3,000-pound car), the coefficient of rolling resistance
 ![]() is sometimes expressed in Newtons per kiloNewton, or get this, kilogram per ton. What?
is sometimes expressed in Newtons per kiloNewton, or get this, kilogram per ton. What?
Equation 1 Rolling Resistance

Where cr is the coefficient of rolling resistance, which is also sometimes expressed as RRC for “rolling resistance coefficient.”
Table 1 shows how rolling resistance can vary for passenger-car tires. For example, moving from a class-B tire to a class-A tire can save 1.5% on fuel costs.
Table 1 Rolling Resistance Classes
 Rolling Resistance Realities
Bicycles provide an easy grasp of rolling resistance for anyone who has ridden a bike, and I think that captures all readers. Fatter tires and less tire pressure are great for traction, especially on snow, ice, or wet pavement, but that comes with far more rolling resistance than skinny tires inflated to high pressure. For example, a road bike with skinny tires inflated to 110 psig[2] presents far less rolling resistance than a fat-tire bike with tires inflated to 10 psig. My quads burn just thinking about cranking on one of those behemoths. Burning quads means lots of energy expenditure or power, resulting in less efficiency getting from A to B – but this beats a broken hip I might get by crashing a road bike on ice.
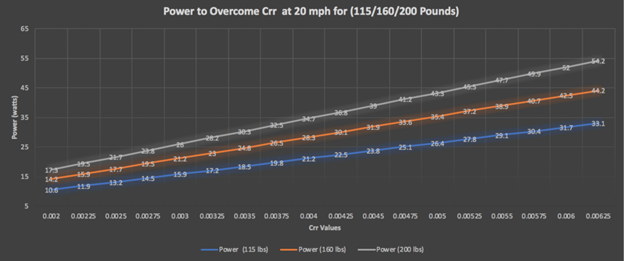
Figure 1 from TrainingPeaks.com provides an excellent illustration of rolling resistance versus bicycle velocity and biker weight. Since power equals force times velocity and force (rolling resistance) is constant, the power to overcome the rolling resistance varies directly with speed.
Since the rolling resistance coefficient for the tires is constant, the rolling force increases with rider weight, as shown. The same concepts apply to automobiles. Heavier cars have more rolling resistance, and all else is equal.
Figure 2 Bicycle Rolling Resistance Power
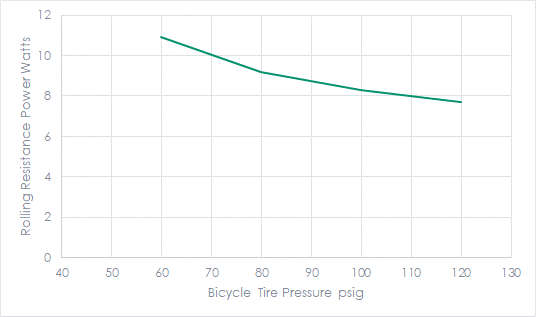
 Figure 3 plots data provided on the TrainingPeaks.com page, showing how the power to overcome rolling resistance varies with tire pressure. Higher tire pressure means more leisurely peddling.
Figure 3 Rolling Resistance Versus Tire Pressure
 With these basic concepts, we’re ready to discuss more complex factors related to tires and fuel economy for all types of passenger vehicles next week, including electric and internal combustion engine vehicles.
[1] https://toptirereview.com/rolling-resistance-how-to-measure-it/
[2]Pounds per square inch gage pressure.

 Rolling Resistance Realities