The Gorilla in Our Midst: Don’t Let Load Factor Make a Monkey out of You
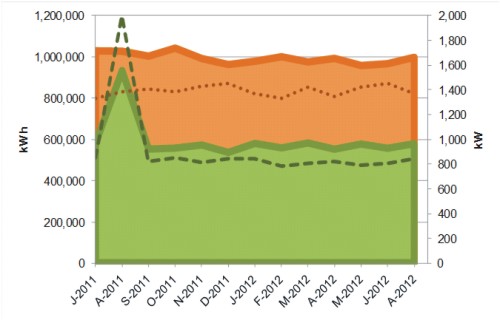
Let’s consider two factories, each with 24/7 operation. Today’s trick question is, which has the larger utility bill? (kWh – solid colors; kW – dotted and dashed lines).
The trick of the question is not sleight of hand – it’s not like the green customer uses more energy than the orange. In fact, the orange customer uses 70% more energy than the green. So what’s the trick? Despite that huge gulf in usage, these two customers would have nearly identical monthly bills.
Now, most rates are more complicated than this example, but we’re reducing all of the ins and outs of rates into one component: load factor. What’s that? Well, the 800 lb gorilla of the utility business is peak day — say, the afternoon of the hottest day of the year, when everyday home and business use is dogpiled by all those air conditioners turned up to 11. The gorilla isn’t that there’s not enough fuel to generate that much electricity, it’s that there might not be enough power plants to meet this demand. This is the difference between energy and demand: energy is to coal as demand is to power plants.
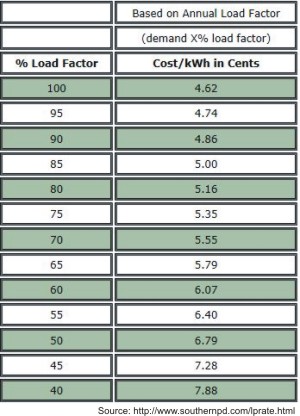
Peak day and other utility forecasts are about predictability and customers whose usage is unpredictable pay a premium. That measure of unpredictability is load factor — the ratio of how much power you demanded last year on average compared to how much power you demanded at your most energy-intensive 15 minute period. The table shows how one Nebraska utility adjusts rates based on load factor. Clearly, customers with high load factor pay lower average rates.
Those 100% customers see pretty low rates — they draw the same amount of power day in and day out. Their daily use is essentially the same as their “peak” use — no surprises.
For 40% customers, rates almost double. On their peak day, they require 2.5 times as much demand as they do on average. These are the kinds of customers that make utilities buy expensive electricity from peakers — expensive-to-operate plants that only kick in when cheap base load plants are maxed out — and these rates demonstrate how they equitably pass those costs on to their customer base. If our green customer lost that seasonal peak and became a 100% customer, their bills would drop by more than 40%.
580,000 kWh/month x 4.6¢/kWh = $27,000
Vs.
580,000 kWh/month x 7.9¢/kWh = $46,000
A good energy efficiency audit will calculate demand savings, and if a customer whose low load factor means shelling out a premium price on bills, tell the energy professional that a special focus on shaving off kilowatts is needed. There are many clever ideas out there — like making tons of ice during the middle of the night when demand is low so that there is daytime access to the cold side of a heat exchanger without having to overexert the chillers. With the next audit, demand less demand.