
I think nearly everyone reading this knows Trump’s budget blueprint calls for eliminating the popular ENERGY STAR® program. This is an enormous topic, so let’s dive in and see where Jeff takes us.

Absurdities
I have no idea what Trump is thinking – that eliminating this program will do anything for profligate, runaway, candy-for-all federal spending. The Huffy Post and NPR both claim the program costs about $50 million a year to administer. I could not confirm this with a conservative news source, in 15 minutes of precious research time. Perhaps the reason is the budget cut is so absurdly tiny.
Fifty million dollars to the federal leviathan isn’t even a rounding error. It is about one one-thousandth of a rounding error: to wit, 0.0014% of the federal budget.
One guess for Trump eliminating ENERGY STAR might be that he is collecting a wall of program-kill trophies – you know, stuffed animals and heads. If ENERGY STAR were a trophy, it might be a mourning dove.
In a comparatively absurd detail, which also happens to be less than a rounding error, the LA Times reports that taking down ENERGY STAR will personally benefit Trump because his buildings are energy hogs. Valley girl alert: I am so sure! Like, all of his customers are so energy conscious. Hyaaaaah! Totally!
Value of ENERGY STAR
Widget Quals
When I first encountered ENERGY STAR in the 1990s, I thought it was a crock of hooey, at least for widgets including appliances, lights, windows, etc. Since then, the value of the widget qualification has grown on me, even to the point that, yeah, the mini-split ductless system I am about to purchase and install is ENERGY STAR rated. That means something to me. And woohoo! Focus on Energy has a $300 rebate for this $14,000 system. Hey, evaluator – write it up now. I’m going to take the insult, er $300, and that is a 100% free rider[1]. I haven’t purchased or installed it yet, and the insult had no effect whatsoever on my purchase. Thank you!
This article from conservative Heritage Foundation pans ENERGY STAR and points to a couple goofy examples of poor deployment of efficiency. You should read the paragraph yourself because the wording is slippery. One example includes “push[ing]” manufacturers to adopt a technology to save energy while microwave ovens are not in use. This resulted in a technology that “caused the ovens to fail 50 percent of the time”. What does that mean? Half of them failed on the first try? When? How long did it take to fail? Think critically, reader. The snake speaks.
The article goes on to say how people brag about the efficiency of their stuff. Snake – if you don’t have an independent lab test and measure performance, how does anyone know the efficiency, and therefore, even have the information with which to brag?
ENERGY STAR has a place for widget efficiency and performance.
Portfolio Manager (Whole Buildings)
Certainly, improvements need to be made to ENERGY STAR. For instance, ENERGY STAR Portfolio Manager, used for gauging efficiency of whole buildings, needs an overhaul, and it needs to be more transparent. I am not talking about the interface. I am talking about what does a Portfolio Manager score of 75 really mean? A score of 75 to 100 on a scale of 1 to 100 makes a commercial building eligible for earning the ENERGY STAR label. Everyone is above average as noted in Energy Star Portfolio Manager and the Lake Woebegone Factor. The case noted in that post, using Chicago as an example, is not unusual (more below). The typical average score of a portfolio of buildings hovers right around 75. Woohoo, everybody gets a trophy!
I spent a morning way back when trying to decipher Portfolio Manager scores’ meanings. The EPA / ENERGY STAR won’t say, but a cursory review of articles seems to indicate others think like I used to think – that the score represents where a facility lines up, efficiency-wise, in a large population of similar buildings. For example, a Portfolio Manager score of 50 would indicate the building is average, as noted in this article from Energy Manager Today. And this article from Green Building Law Update confirms as one example that a score of 75 means a building is more efficient than 75% of its peers.
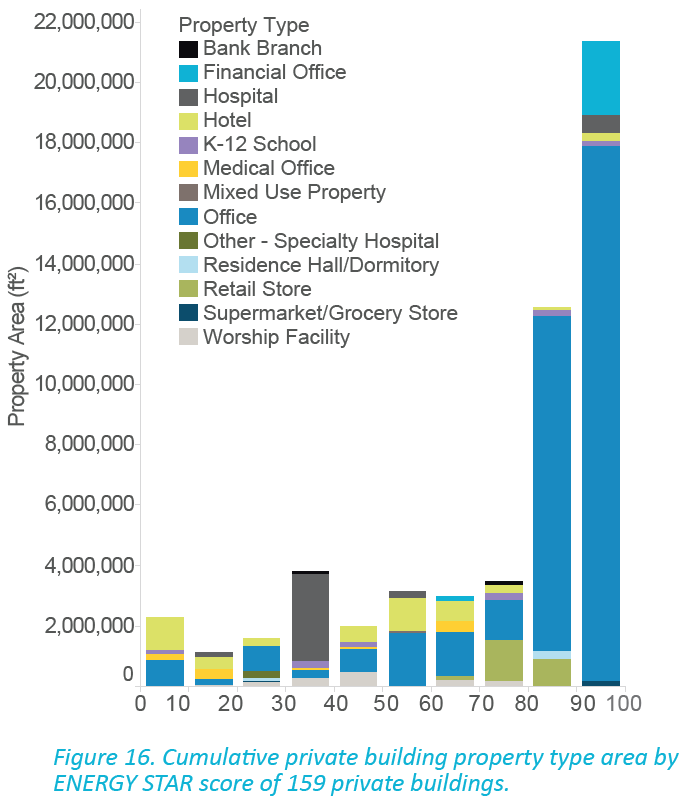
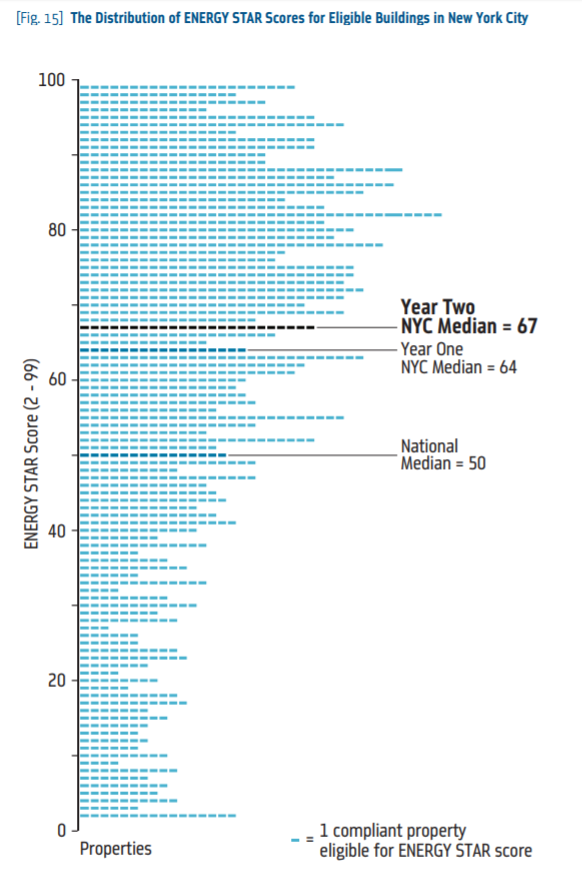
Not so, I’m afraid. See the city-wide benchmarking results (to the left) using Portfolio Manager for Minneapolis and New York City. Those are not exactly normal distributions (bell curves) or more appropriately, with something close to even counts in each column.
The EPA needs to clean this up because unlike miles per gallon, no one knows what these fuzzy trophies-for-all mean. I am not a proponent of ENERGY STAR benchmarking until it is clarified and made transparent.
More on this topic to follow, particularly, privatizing ENERGY STAR. How in the,,, will that work?
[1] Future Rant pending.