
A blog post from OpenEE with a title M&V Adjustments Create a Bias Towards Savings Inflation[1] is a good troll for a guy like me – a cynic who can’t stop writing the Rant even when I tried to quit a dozen times.
Anyone with a pulse needs a relief valve, and the Rant does the job for me. Products designed to reduce stress, like stress balls or foam bricks, would never work. For instance, if I want to get even with a computer, do I want to grab one of these things and start squeezing? No. I want to take my laptop to the fourth floor and drop it out the window onto the concrete below, preferably just in front of a cement truck that will grind it to bits (pun alert). For maximum therapeutic benefit, I would make sure to have the laptop open to maximize the thrill of crashing sounds and flying debris. Fortunately, I love my PC, and it loves me.

Savings at the Meter
As alluded to in the past few posts, our industry needs to meter savings and treat the savings as grid resources for energy and demand. Doing this requires metering of savings with interval data. First, we develop a predictive model of energy consumption using independent variables that affect energy use. It sounds complicated, but it isn’t too bad. In fact, talking with an OpenEE representative, I learned that for commercial and residential buildings, outdoor temperature is the primary independent variable. Time of day and day of the week, of course, are the other major variables. Simply put, your home energy use depends on weather and whether you are home (time of day, day of week). Easy.
The predictive model is also known as a regression model that minimizes the difference between actual and predicted values; or to geek for a minute, the method of least squares.
Second, the program intervenes with equipment retrofits, operations and maintenance, retro-commissioning, or any behavioral effort which may include lighting cops, games, fines, or prison sentences. From intervention forward, the project developer should see a difference between the status quo modeled consumption and the post-intervention consumption.
The following famous chart[2] provides an example, showing predicted energy consumption versus actual, before (baseline) and after intervention (implementation period).
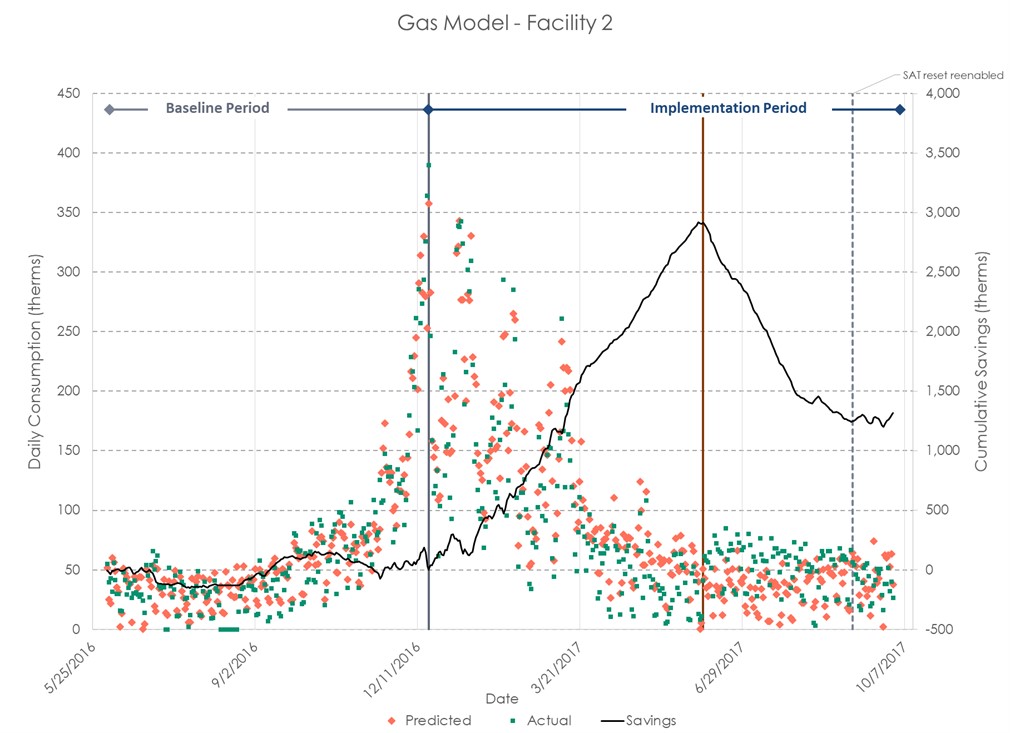
Right around the first of the year, 2017, savings start to accumulate as shown in the Everest-looking savings profile. However, around June 2017, the customer fell into their rut and reversed the control strategy that achieved the savings. By the end of the period, we recognized the reversal and moved forward, saving energy once again. Hurray!
Inflated Savings
The crux of OpenEE’s blog was that nobody has incentive to find why savings are higher than projections, and therefore, the greater savings are assumed to be overachievement of project performance. On the other hand, if savings fall short, program aggregators or project developers in pay-for-performance (P4P) programs are more likely to dive into models or even site investigations to figure out why savings aren’t occurring as anticipated – and then fix it, or explain it away.
First, in the case of OpenEE’s blog post, I think it is assumed that savings projections exist. In behavior, O&M, retro-commissioning, or another control-related program, a regression model is a multi-faceted tool: it is a lever, vise-grip, hammer, screwdriver, scissors, and measuring stick all in one. Note that anything hard with mass can be used as a hammer. Plyers, wrenches, mauls, rocks, logs, boards… you’ve been there.
How is the regression model multi-faceted?
- It provides leverage with visual evidence, so customer stakeholders do more and climb higher.
- It’s a vise-grip to maintain what was accomplished.
- It’s a hammer to “persuade” folks.
- It’s a screwdriver to drive continuous improvement.
- It’s a scissors (cheese alert) to cut waste.
- Finally, it’s a measuring stick to verify performance.
Counterintuitives
OpenEE states finding and fixing the outliers, or “non-routine” events, cause bias in the results. This is depicted in the cartoon below from their post. Project developers fix or explain away underachievers and leave the overachievers causing the bias. Fixing problems is fine and good. We want customers to save energy, right? We want efficiency as a grid resource, right?
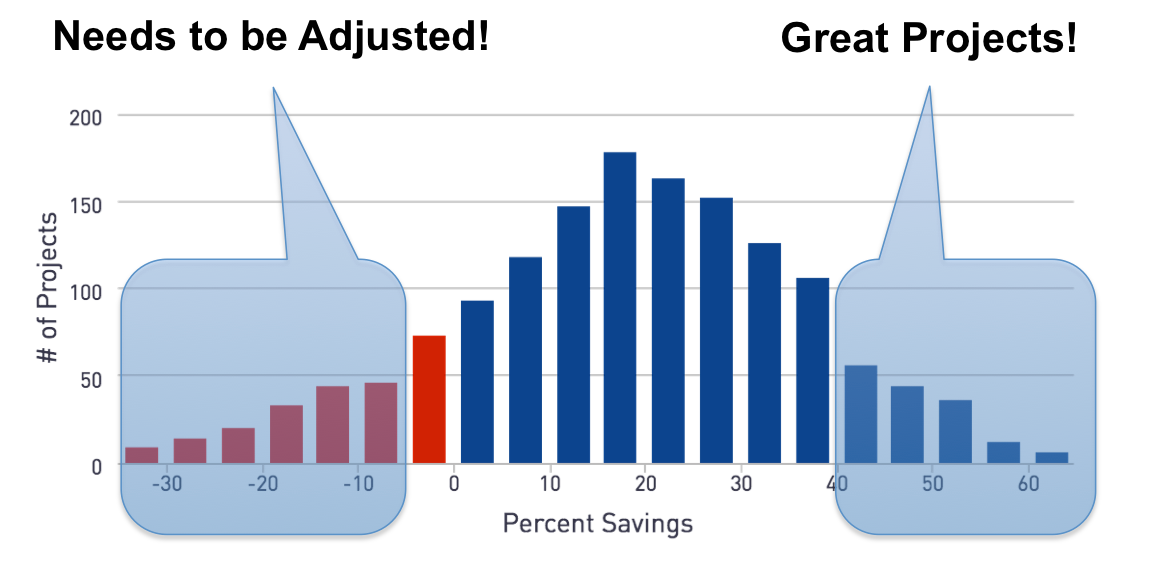
The problem, or counterintuitive, is no one is out running around to see why the outliers on the other side are over-performing. Are they over-performing because they had a 30% RIF and emptied two floors of an office building? Or maybe they replaced a chiller with one that is twice as efficient and that increased savings in addition to the lighting project being evaluated. In other words, something other than the project at hand is moving the needle.
Challenges
There are many challenges with the nirvana of metered savings that I share with OpenEE. This post only describes one. Another major one includes: what happens in a state like California where program aggregators are sliced and diced by technology, industry, program type, etc., going after savings in the same facility? The avoidance of double counting will be a vast challenge. Did someone say great projects and outliers? We’ve seen a tracking system database or two. M-e-s-s. Turn the cats loose!
[1] M&V = measurement and verification. I.e., what did the project, program, or portfolio of programs save, as measured?
[2] How is it famous? It’s in this blog, isn’t it? If that isn’t enough, it was recently published with the ACEEE Summer Study Proceedings. Keyword: Dvorak


Join the discussion 3 Comments