In April of this year, I commented on the Center of the American Experiment’s report, Energy Policy in Minnesota: The High Cost of Failure. That post is here. As a wee lad, I liked Curious George, so let us dig in and see if we can tweeze the fibers that drive the cost of electricity.
Wind and Electricity Prices
American Experiment’s claim is that wind energy with near-zero marginal cost of production does not result in lower energy prices for consumers. In fact, they say it increases electricity prices. This is where I began.
Data for this post come from the Energy Information Administration here or the EPA’s eGrid data here. You can cross check my work at your leisure, but I already did that with various publications, including the American Experiment’s.

What do price trends look like as a percentage of wind-energy penetration? This is the first question because that seems to be the sole claim of the High Cost of Failure. I plucked data from fully regulated states going back to 1990, across a vast swath of the fruited plain, just to weed out any weird stuff. Results are shown below. The percentages on the legend reflect the portion of electricity that is produced by wind in each state.
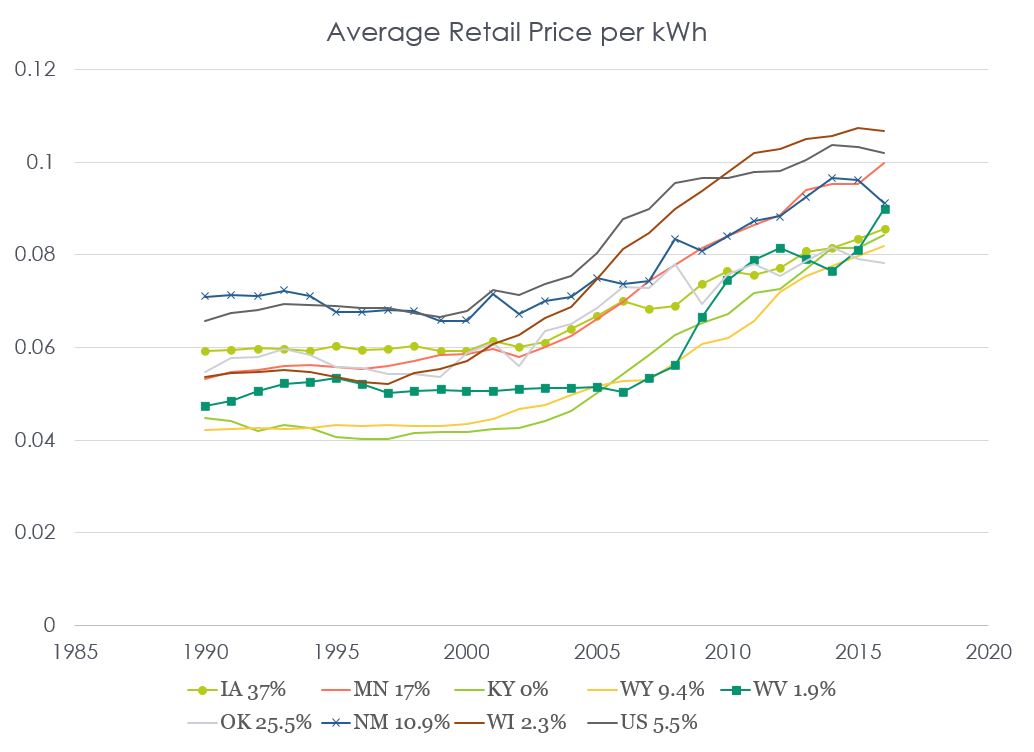
Can we conclude anything from the data? Well, I can conclude that American Experiment’s data indicating the cost advantage average Minnesotans had compared to average Americans has disappeared, as of 2016 – the most recent year for which data are available. However, no offense, but Minnesota is kind of a mid-packer when it comes to wind production. What I’m seeing is exponential price increases with the exception of the US as a whole, and Wisconsin, the latter of which shows quite a, uh, poor trend.
What else does the chart demonstrate? Flat prices from 1990 to 2000 followed by pretty sharp increases.
Deregulation
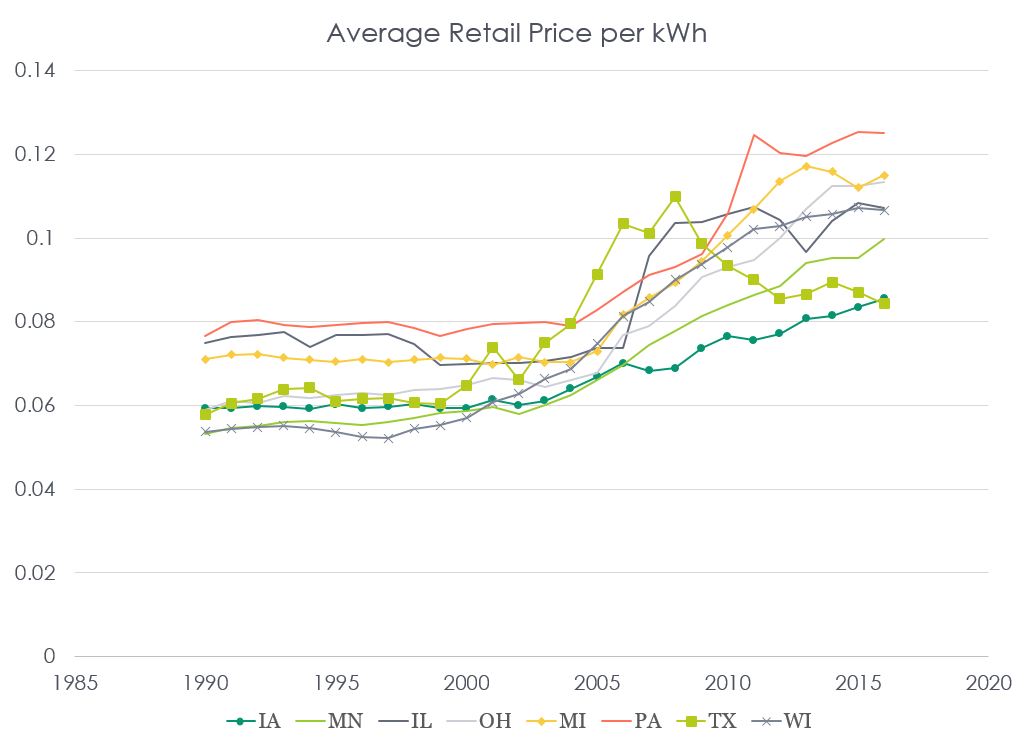
Electricity prices for the US rose most sharply for ten years starting in 2000. Since then, they have begun to flatten. This is what I recall from deregulated states as well. The following chart shows prices with deregulated states of IL, OH, MI, PA, and TX tossed in.
What do we see here? Volatility. Congratulations, Pennsylvania, Michigan, and Ohio. You have all blown past Wisconsin. Of these states, we, of course, have Texas as the big wind producer, and Texas prices have dropped in recent years. Why? Largely because Texas is drowning in natural gas, a byproduct of Permian Basin crude oil extraction. They have so much excess natural gas, they are simply flaring it. I.e., wasting it. How much? A million dollars’ worth per day!
Do you realize how much natural gas that is? It is enough to pump 2500 megawatts around the clock – four or five large combined cycle power plants. Another way, the flared gas produces the same emissions as 2 million cars. OMG! This is one of the most amazing byproducts (pun alert) of facts I’ve ever found.
Many Factors
We can see many factors play into electricity prices. Certainly, penetration of renewable supplies is one factor. Coal plants have struggled mightily in Texas and Pennsylvania. First Energy’s merchant coal plants and TXU’s (Oncor’s) coal plants have all filed for bankruptcy.
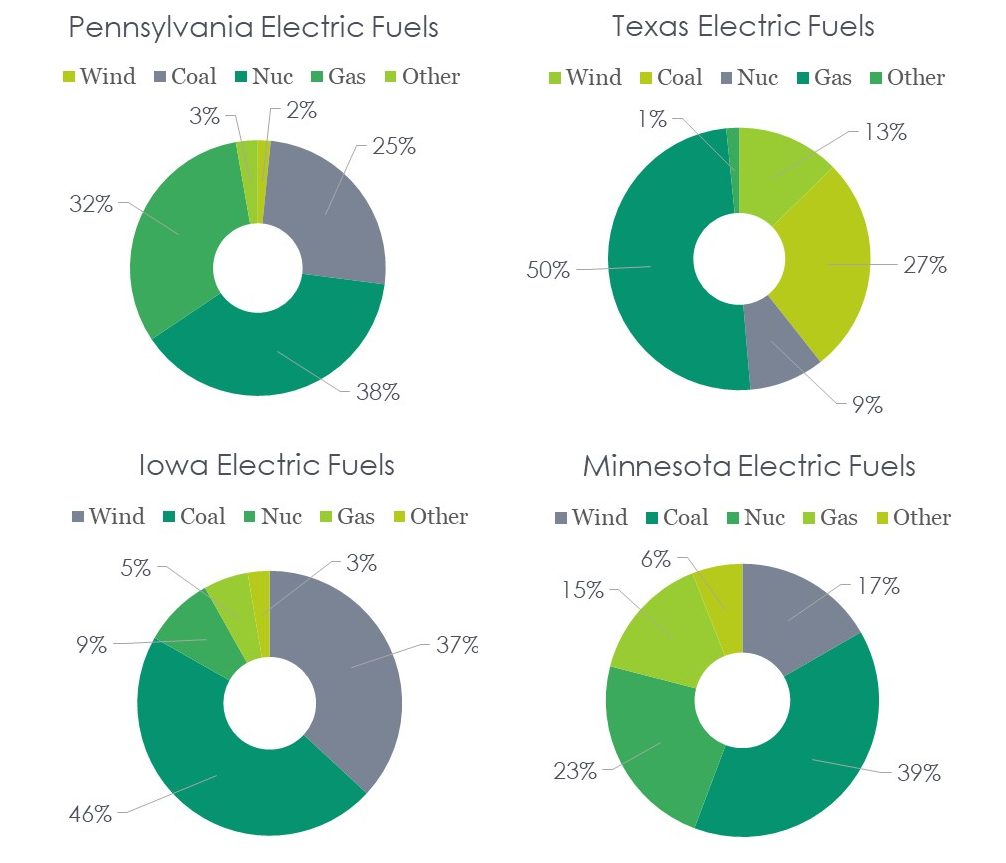
What about Illinois? A lot of nukes. What is left of those states in the previous chart? Minnesota and Iowa are still trending exponential price increases, and I have not seen any natural gas rigs in either state. In other words, natural gas isn’t as cheap up here as it is in Texas.
Observe the next chart to see the vast use of Texas’ other “free” fuel, natural gas, a byproduct of crude production. In the upper Midwest, Powder River Basin coal is still king.
What’s Next
What is going to happen next? To maybe answer that, let’s look back and see why electricity prices were flat for so long before taking off, starting around 2000, just as there was a lot of bush beating about deregulation. According to this site, all deregulated states did so between 2003 and 2010. The site also provides an answer as to whether deregulation worked. To me, it would depend upon whether the metrics include bankruptcies and price increases.
The price surge in the 2000s can be summed up with two plots from the EIA. Utilities went on natural-gas-plant and transmission-system spending blowouts. You can see why prices were flat in the 1990s as nothing was built during the days of “the era of big government is over.”[1]
I recently found the following chart. Wow! Look at the PJM transmission system blowout. Midcontinent (Minnesota and Iowa) are ramping up transmission spending.
When a lot of stuff gets built, prices increase. There are few ways to avoid that, and they include:
- Customer load growth, which has been non-existent
- Subsidies, which phase out over five years
- Fuel costs – natural gas has a particularly volatile price profile
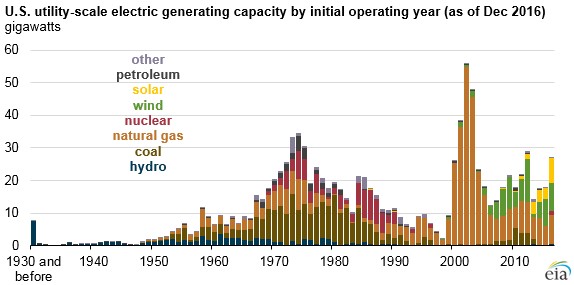
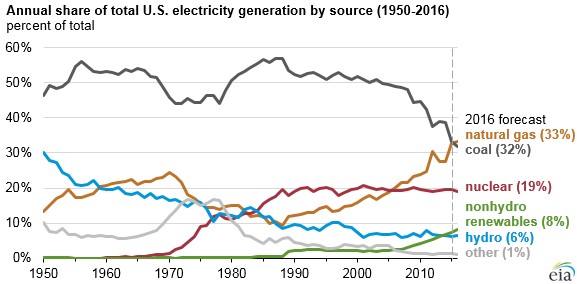
Finally, per the EIA electricity generation shares plot below, coal is on the decline while renewables and natural gas are on the climb, particularly since 2000. Coincidence? The pictures of construction, fuel switching, and price curves converge to tell the story.
[1] Bill Clinton, in case you missed it.


I’m not sure what your analysis of recent wind investments and customer energy prices was supposed to find. But your implications are misleading. Wind energy is cheaper to produce by far, especially in the Midwest. This is why Xcel is heavily investing in wind. They are a for profit company so they are going to do things that make financial sense, not environmentally friendly. And since they are a monopoly they have no competition (at least yet) to pressure them to reduce rates. Residential solar might keep them in check.
The reason residents haven’t seen the cost savings is because of the regulatory environment and how prices are set. Utilities bring their case before the PUC and argue they need to raise rates. The PUC negotiates them down to an increase that seems fair, but generally results in a slight increase. Utilities are regulated and are not allowed to make a large profit off of kWh sales, so they make most of their profits off capital improvements and billing the rate payers. So the utilities gain in capital assets.