Evaluation, Measurement and Verification 2.0, or EM&V 2.0, is a nerdy term coined in 2014, according to this blog by Northeast Energy Efficiency Partnerships (NEEP). The hype of EM&V 2.0, which I will explain later, is that it will automate measurement and verification, putting us engineers out of business. This is not going to happen anytime soon.
Definition 2.0
The definition of EM&V 2.0 boils down to using utility meter interval data[1], typically hourly or sometimes every 15 minutes, or maybe even 5 minutes, to disaggregate and measure impacts from energy efficiency measures.
One could consider that EM&V 2.0 is on the back-end of an energy efficiency effort just as virtual audits are on the front end of an energy efficiency endeavor. However, the producers, marketers, and sellers of virtual audit software, which also uses interval data, do not claim disaggregation and specific energy savings potential with sufficient precision to make specific recommendations. Instead, they serve as a sound method for determining facility overall potential and provide clues to what may be wasting energy.
Hype 2.0
The blog linked above takes a statement from an ACEEE paper on EM&V 2.0 and distorts it as the mainstream press likes to do. Specifically, the blog says, “As a starting point, the paper recognizes the ability to ‘measure energy savings with the same accuracy and fluidity that utilities achieve in measuring electricity consumption.’”
How does the quote from the ACEEE paper read in its entirety? “The energy efficiency sector has had a long-standing goal of being able to measure energy savings with the same accuracy and fluidity that utilities achieve in measuring electricity consumption.”
In other words, the blog implies we have the ability while the ACEEE paper says we have this pipe dream to accurately quantify impacts with EM&V 2.0.
Technology is great, but predicting the future is treacherous. As I was looking for a futuristic depiction of transportation published by Public Utilities Fortnightly, I stumbled onto this better one, featuring the whale bus. Notice in the image that one dude is prodding the whale and the other steering, as though that would overpower the whale’s steering mechanisms. This most certainly was not an engineer’s idea because the drag coefficient on that square bus is awful. But why not? To this day, we have Amish cruising the local roads with intelligent mammals (horses) powering their way.
State of the Art 2.0
This year’s ACEEE Summer Study on Energy Efficiency in Buildings featured a paper by DTE Energy and Navigant. As everyone reading this probably knows, this is what ACEEE in large part does – features emerging technologies, programs, and methods of evaluation. Therefore, we can safely assume a paper entitled, “M&V 2.0: Hype vs. Reality”, includes information I can use for this post. You can find this paper in the proceedings here.
The technology and methodology of EM&V 2.0 will first apply to residential impact evaluation. If buildings were dimensions, residential would be one-dimensional (linear) while commercial and industrial would be four-dimensional (x, y, z, and t, where t is time). Get it? Each dimension exponentially complicates things. For example, commercial buildings might be two to the fourth power, or 16 times more complex, at least.
The M&V 2.0: Hype vs. Reality paper indicates there is only one provider of residential EM&V 2.0 software, and there is no evidence of utilities using software to replace traditional impact evaluation. The project behind the paper has not been completed. It describes findings in search of state of the art (no one doing it yet) and requirements for a platform to deliver impact evaluation. These include:
- Determining energy and demand savings using AMI (advanced metering infrastructure, aka, smart grid)
- Data acquisition via the internet
- Scalability
- Etcetera
State of Disaggregation Art
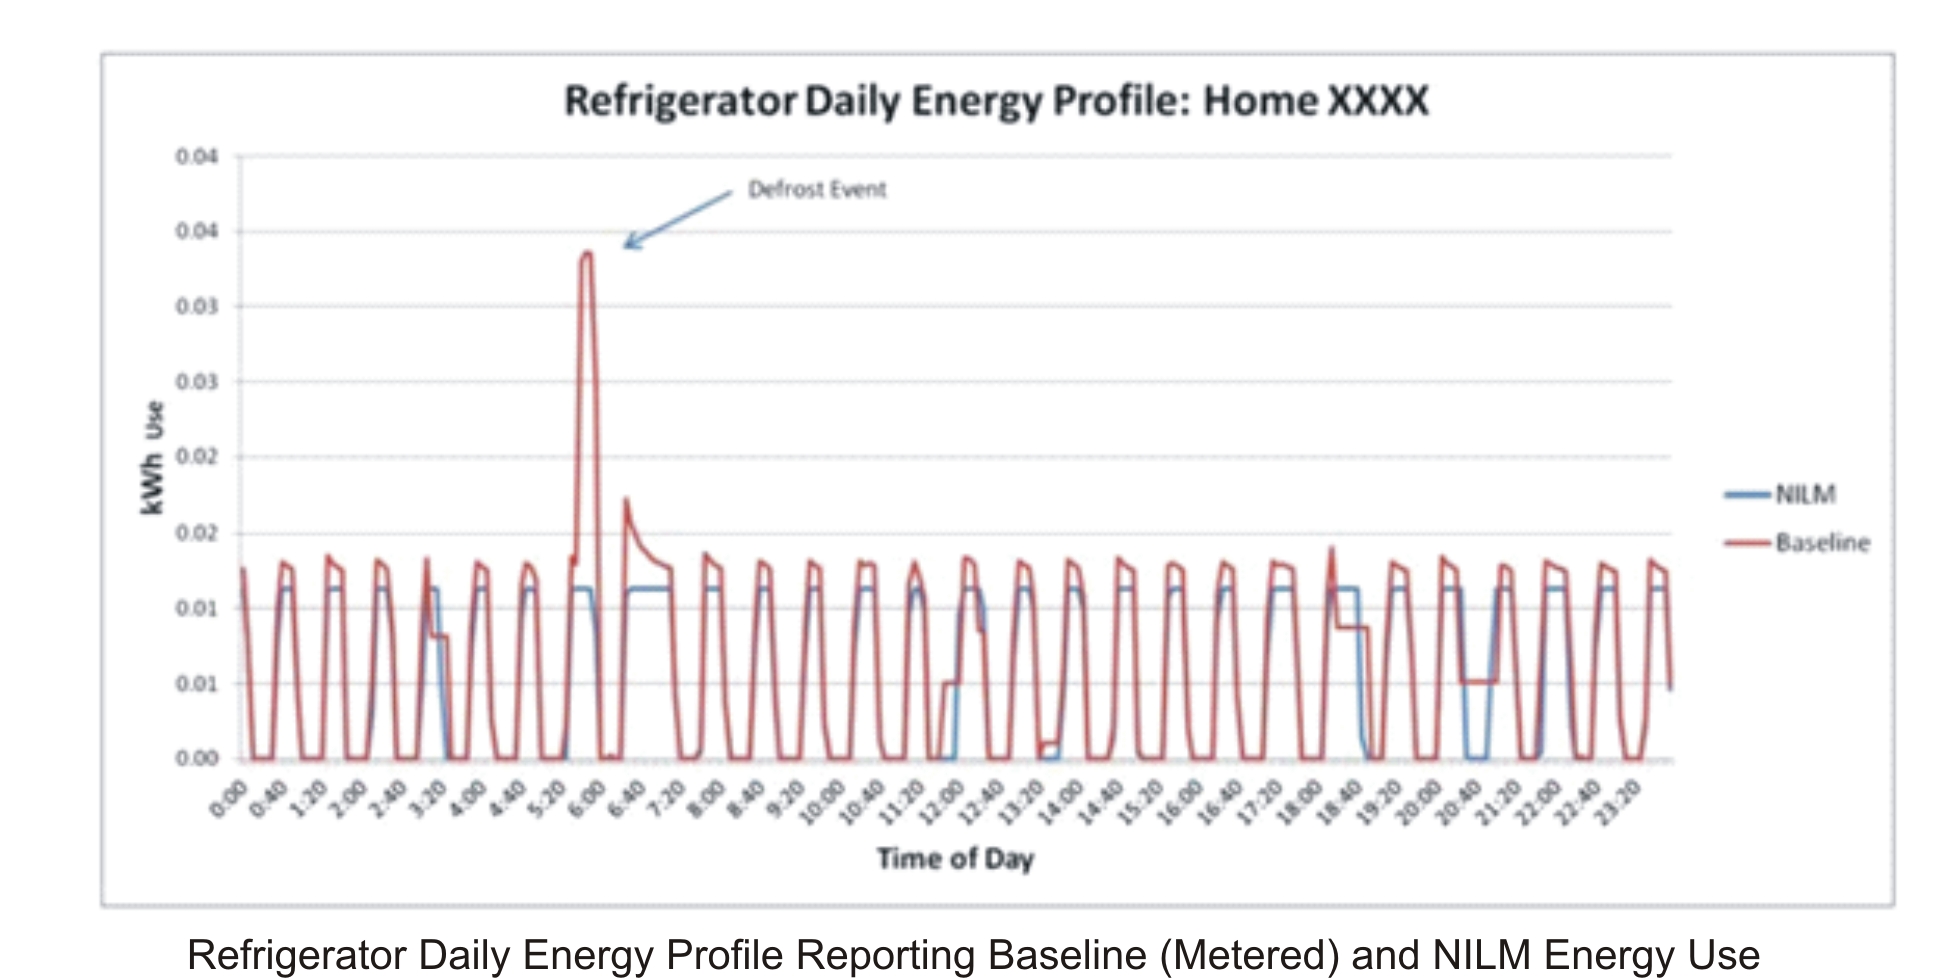
A separate ACEEE Summer Study paper led by Pacific Northwest National Laboratory (PNNL) titled Load Disaggregation Technologies: Real World and Laboratory Performance, presented findings of load disaggregation using interval data. What does load disaggregation have to do with EM&V 2.0? Everything. EM&V 2.0 seeks to tweeze measure-level data from utility-meter interval data to precisely measure-level savings.
The PNNL paper includes the following data (see chart above) for singling out energy consumption of a refrigerator. In this case, NILM is non-intrusive load monitoring (blue), which represents EM&V 2.0. The baseline (red) represents old-fashioned accuracy with a power data logger.
The errors are substantial, particularly when considering the error magnitude shown might be on par with the savings; i.e., a few percentage points.
A Whale Bus or an Airbus?
A hundred and ten years ago, probably no one imagined moving hundreds of people hundreds of miles in one airliner traveling 600 mph at 38,000 feet. Possibly more people thought the whale bus was a sound idea. By the way, I would use the whale like a horse to pull the bus rather than as depicted: an upside down bull ride.
I think EM&V 2.0 will be relegated to something like officiating an NCAA Division 1 college football, or NFL game. That is, a combination of human eyes, brains, communication, and technology. I will get into the weeds for this next week.
[1] For an interval data refresher, see Learning Calculus via Demand and Energy


Join the discussion 2 Comments