The Energy Rant is not for the weak-kneed who prefer to live in the land of unicorns, fairy dust, and lollipops. This week is no exception.
This Rant is brought to you by the recent ACEEE paper, Recent Developments in Energy Efficiency Evaluation, Measurement and Verification.
Burned on the Alter of 90/10
A major objective of most evaluation contracts is to punch the 90/10 ticket. To recap, 90/10 simply means there is a 90% chance that the results of the population, if evaluated in full, will be within plus or minus 10% of the results for the sampled, studied projects.
As a reader of many contracts and technical documents, I pay great attention to what words say. Notice 90/10 is all about the sample fitting the population and nothing whatsoever about the accuracy of results. In other words, the sampled project evaluations that are wrong by 50%, when extrapolated to the entire population, will have a 90% probability that the results for the entire population will be wrong by 45-55%.
Congratulations.
This blog includes many posts on the subject including recently in Drive-By Evaluation / Silence of the Lambs, and a few years ago in Impact Evaluation Confidence and Precision – Fluffy Illusions.
The alter of 90/10 is one that squeezes the rigor out in exchange for the high confidence and precision of the sample. I.e., there is a 90/10 chance that my sucky result represents the entire program. Evaluation provides no value when the odds of being wrong, way wrong, are high. It goes like this: we’ll make up for the lack of profit (accuracy) in volume (a big sample).
With inadequate evaluation budgets, we can learn something with smaller samples, or we can fool ourselves with 90/10. It typically lands somewhere in between, as noted in Drive-By Evaluation.
M&V 2.0 Hype
Per the ACEEE paper, M&V 2.0 takes advantage of more granular data, collected much faster, and at lower cost via advanced metering infrastructure.
Let’s be clear – M&V 2.0 simply provides more data, faster. It does nothing but enhance M&V 1.0 methodologies.
Fifteen-minute interval data is no good for disaggregating loads, even on a residential level. In addition to what I wrote last year, 2017 papers from the International Energy Program Evaluation Conference (IEPEC) (for which I reviewed and moderated papers, here, here, and here) show similar bad results from AMI disaggregation. These are smart people, folks.
AMI data provide better information for regression models where whole building meter regression has always been the best M&V option (Option C, of the IPMVP[1]). Such measure types include:
- Just about anything that saves substantial home energy, such as heating and cooling systems or unit replacement.
- Measures where all evaluation alternatives are worse, such as for weatherization, for which bottom-up analysis is a fools game in futility.
- Behavioral measures for all sectors from residential through industrial.
- Building-wide projects with dozens of measures, like retro-commissioning.
Finally, if the evaluation doesn’t include smart people in the field to verify and observe projects, M&V 2.0 does zilch to improve programs. Remote monitoring and regression only provide an answer. Why is the answer low or high, as it always is?
Technical Reference Manuals
For years, top-down experts from the ivory towers have wanted to standardize methods and savings calculations. There is enough in this subject for a full rant, or six. However, I will talk about TRMs because the ACEEE paper discusses them.
Beware What You Wish For
The old cliché applies: beware of what you wish for; you might get it.
I can think of four states in the Midwest alone that developed TRMs, and the utilities, and sometimes even the intervenors, hated it when they got it.
We do a lot of TRM review from sea to shining sea, and we don’t want to touch some of these because the stakeholders all despise the TRM. Rather, we observe as stakeholders ourselves while our competition gets pilloried in a winless situation.
In another case, one state’s first TRM is taking a ball-peen hammer to programs because suddenly many of the measures have fallen from the cost-effective column to the not-cost-effective column. I haven’t been involved with that, so I cannot say why, but I’ll bet the intervenor group, who thought a statewide TRM would be grand, rues the day they got their way.
Inadequate or Ignored Maintenance
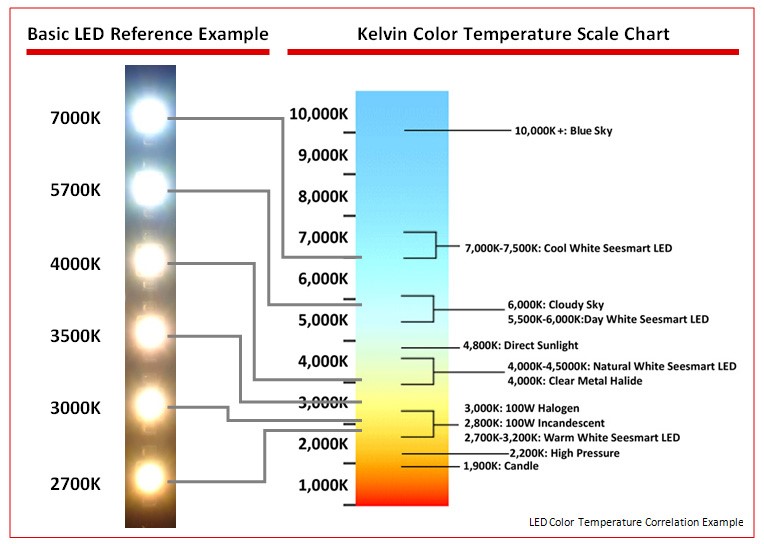
Many measures in TRMs need to be frequently re-evaluated. Consider how fast market effects can change and how fast markets can be transformed. I talked about the incredibly fast market transformation of LED lighting in Driving Ms. Free Rider Daisy a couple months ago. Shortly after moving into the house I discussed then, every incandescent light bulb has been tossed in lieu of $3-4 LED bulbs. Prices have tanked, and consumers can get whatever color temperature they like. Just beware of the color temperature!
Finally, findings are often ignored, as with programmable or smart thermostats. They don’t save energy, especially for cooling, as I described in Cooling System Temperature Control – No Savings. What to do? Carry on as though the evaluation never existed. To do otherwise would be too traumatic for the portfolio.
Do It Right
The problem with evaluation is the entire industry has low-balled it’s way to the 90/10 fallacious wonderland with inadequate funding. That gets in the way of learning and improving. Why bother with completely wrong answers? What good does that do?
[1] International Performance Measurement and Verification Protocol


