
I was planning to write about industrial efficiency and the crimes of opting out this week, but while searching for supporting data, I found other interesting stuff; namely the cost of saved energy by state and by year. In 2009, ACEEE published a paper, Saving Energy Cost Effectively: A National Review of the Cost of Energy Saved Through Utility-Sector Energy Efficiency Programs (short titles are not one of their strong suits). A few years later they published an updated paper for the 2014 Summer Study For Energy Efficiency in Buildings. This one was called, Still the First Fuel: National Review of the Cost of Utility Energy Efficiency Programs.
I took a sampling of states from coast to coast to include Connecticut, New York, Massachusetts, Iowa, Minnesota, and Oregon. Why these states? Because they represented the most readily available, and most complete sets of data, provided by ACEEE; and because they cover both coasts and the middle of the country; and because ACEEE split California by utility, and I wasn’t about to glom that together.
Cost of Saved Energy
The cost of saved energy, also known as CSE, includes program administration, payments to implementation contractors, marketing, incentives to program participants (end users) and both midstream and upstream trade allies, and evaluation.
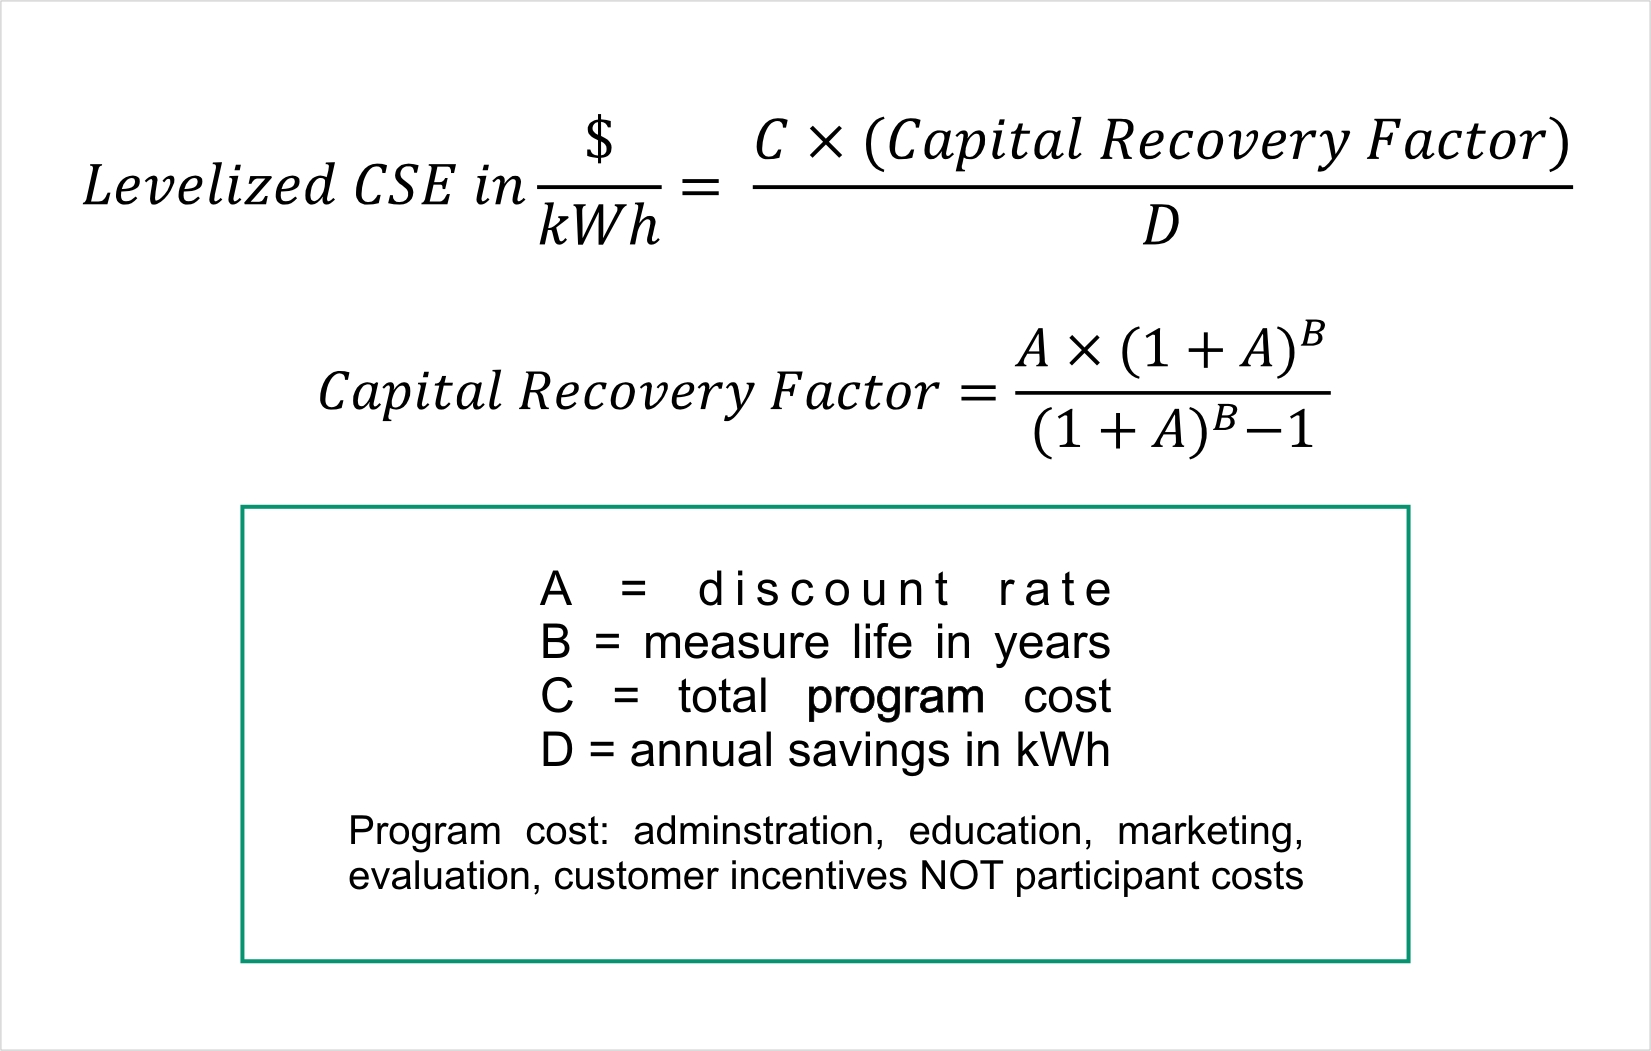
The purpose of determining the cost of saved energy is to compare the cost of energy efficiency as a resource to supply side alternatives. It is expressed both in terms of first-year energy savings as the simplest metric, kind of like simple payback, and also as a levelized cost representing the cost of energy saved over the life of portfolio measures. Levelized CSE represents the present value of the future savings of all measures implemented through a portfolio. Readers are encouraged to derive the following formula using the skills learned in high school algebra class. C’mon, it’s like pushups for the brain. Use it or lose it!
The Other CSE
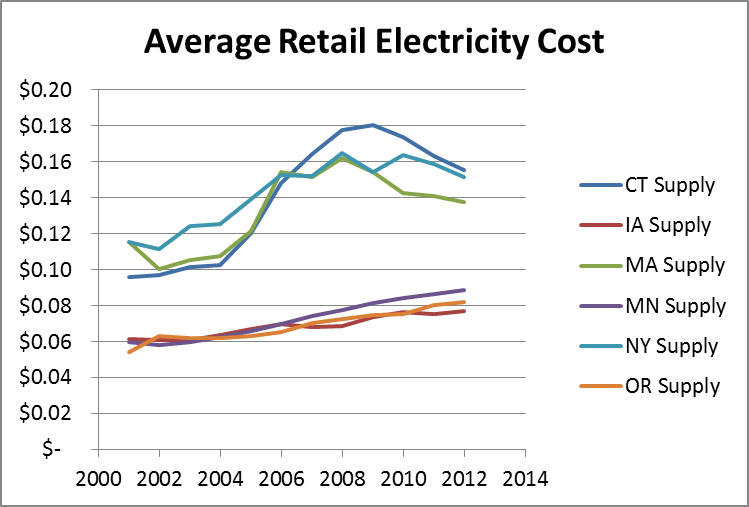
The cost of energy supplied is provided by the Energy Information Administration. I used the blended cost of all electricity sales: residential, commercial, and industrial.
Results
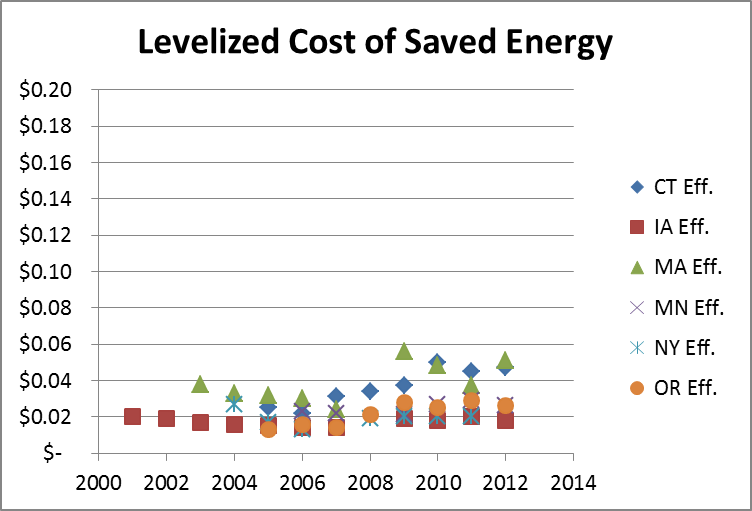
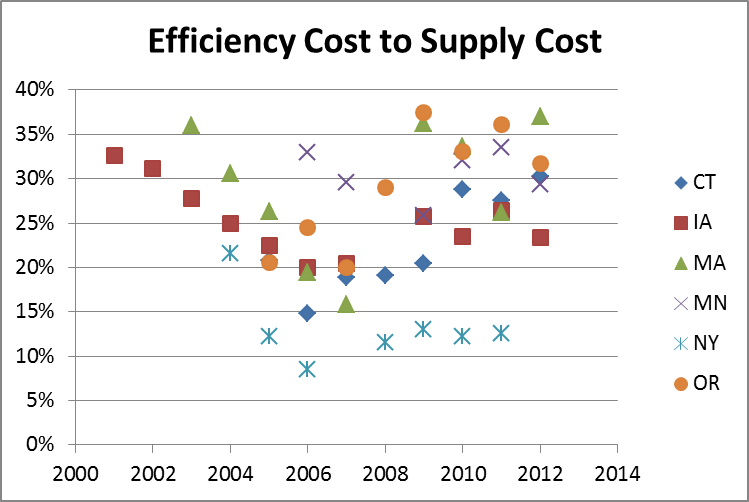
The cost of electricity, cost of saved energy, and ratio of the two are presented in the following three plots, respectively. For the energy cost and energy-savings cost plots, I kept the scales the same for sake of accurate visual comparison. Note there are a few holes in the costs of energy saved data, but there is plenty to chew on.
Discussion
New York, what are you doing? Your cost of saved energy is one tenth the cost of supplying it!
New York has just launched its Reforming the Energy Vision. I have skimmed just a little of this bleeding-edge initiative (eat your heart out California), and I believe there is a lot of realistic, futuristic stuff in there. In the meantime, get more aggressive with energy efficiency already!
The cost of energy saved for Connecticut and Oregon is rising relative to the cost of supplying electricity; less so for Massachusetts. This ratio is falling for Minnesota, Iowa, and New York! Could it beeeeee, poor savings-potential studies cooked up with secondary research???
Cost Effectiveness
In my lowly opinion, these ratios of savings cost to supply costs, and their trends should get a prominent seat at the cost-effectiveness and policy-making table. I first mentioned this back in October of 2014. This post, today, is the resounding sequel.
The total resource cost, or TRC, test is still the dominant cost effectiveness test in the industry regarding what’s in and what’s out. Like all the major benefit/cost tests, it is just that, the ratio of benefits to costs.
TRC benefits include primary and secondary fuel savings and usually an arbitrary collection of non-energy benefits – whatever is required to achieve the desired answer (a passing test). The costs include program administrator, incentive and participant costs.
My argument is, drop the participant contribution and non-energy benefits (NEBs). Why? Because it’s impossible, and if you ask me, foolish to think we can unbundle the reasons why participants buy things (but I do know why people speed up when the light turns yellow).
“But my program won’t pass the test if we ignore NEBs.” Ok. Does that mean we should ditch it? No. It simply means we stop reverse-engineering benefits to make these things pass.
To be sure, NEBs are often critical for the sale of efficiency projects. For example, many projects we develop include dual-fuel savings. Therefore, it is wise to include other fuel savings and quantifiable NEBs to push the project over the top in the eyes of the customer.
Similarly, it is great to promote NEBs for simpler measures, like equipment replacement. For example, last week I was listening to a colleague lament the cost of replacing the brains of an ECM (furnace motor). Incidentally, the furnace is near the end of its useful life. If he had replaced the entire furnace and participated in a program, the program would only take credit for whatever would be installed versus current code. This, too, is lame logic, as clearly demonstrated here. In this case, non-energy benefits blocked savings. Marinate that for a while.


Love everything about this rant. I’ve been advising on efficiency for nearly a quarter century now, and am still amazed at the twisted logic of some cost-effectiveness frameworks (and we’ve worked on many). It’s as if NEITHER accuracy NOR simplicity NOR EVEN common sense logic can ever overcome the weight of legacy decisions.
Philippe Dunsky | President
DUNSKY ENERGY CONSULTING